Workspace tour
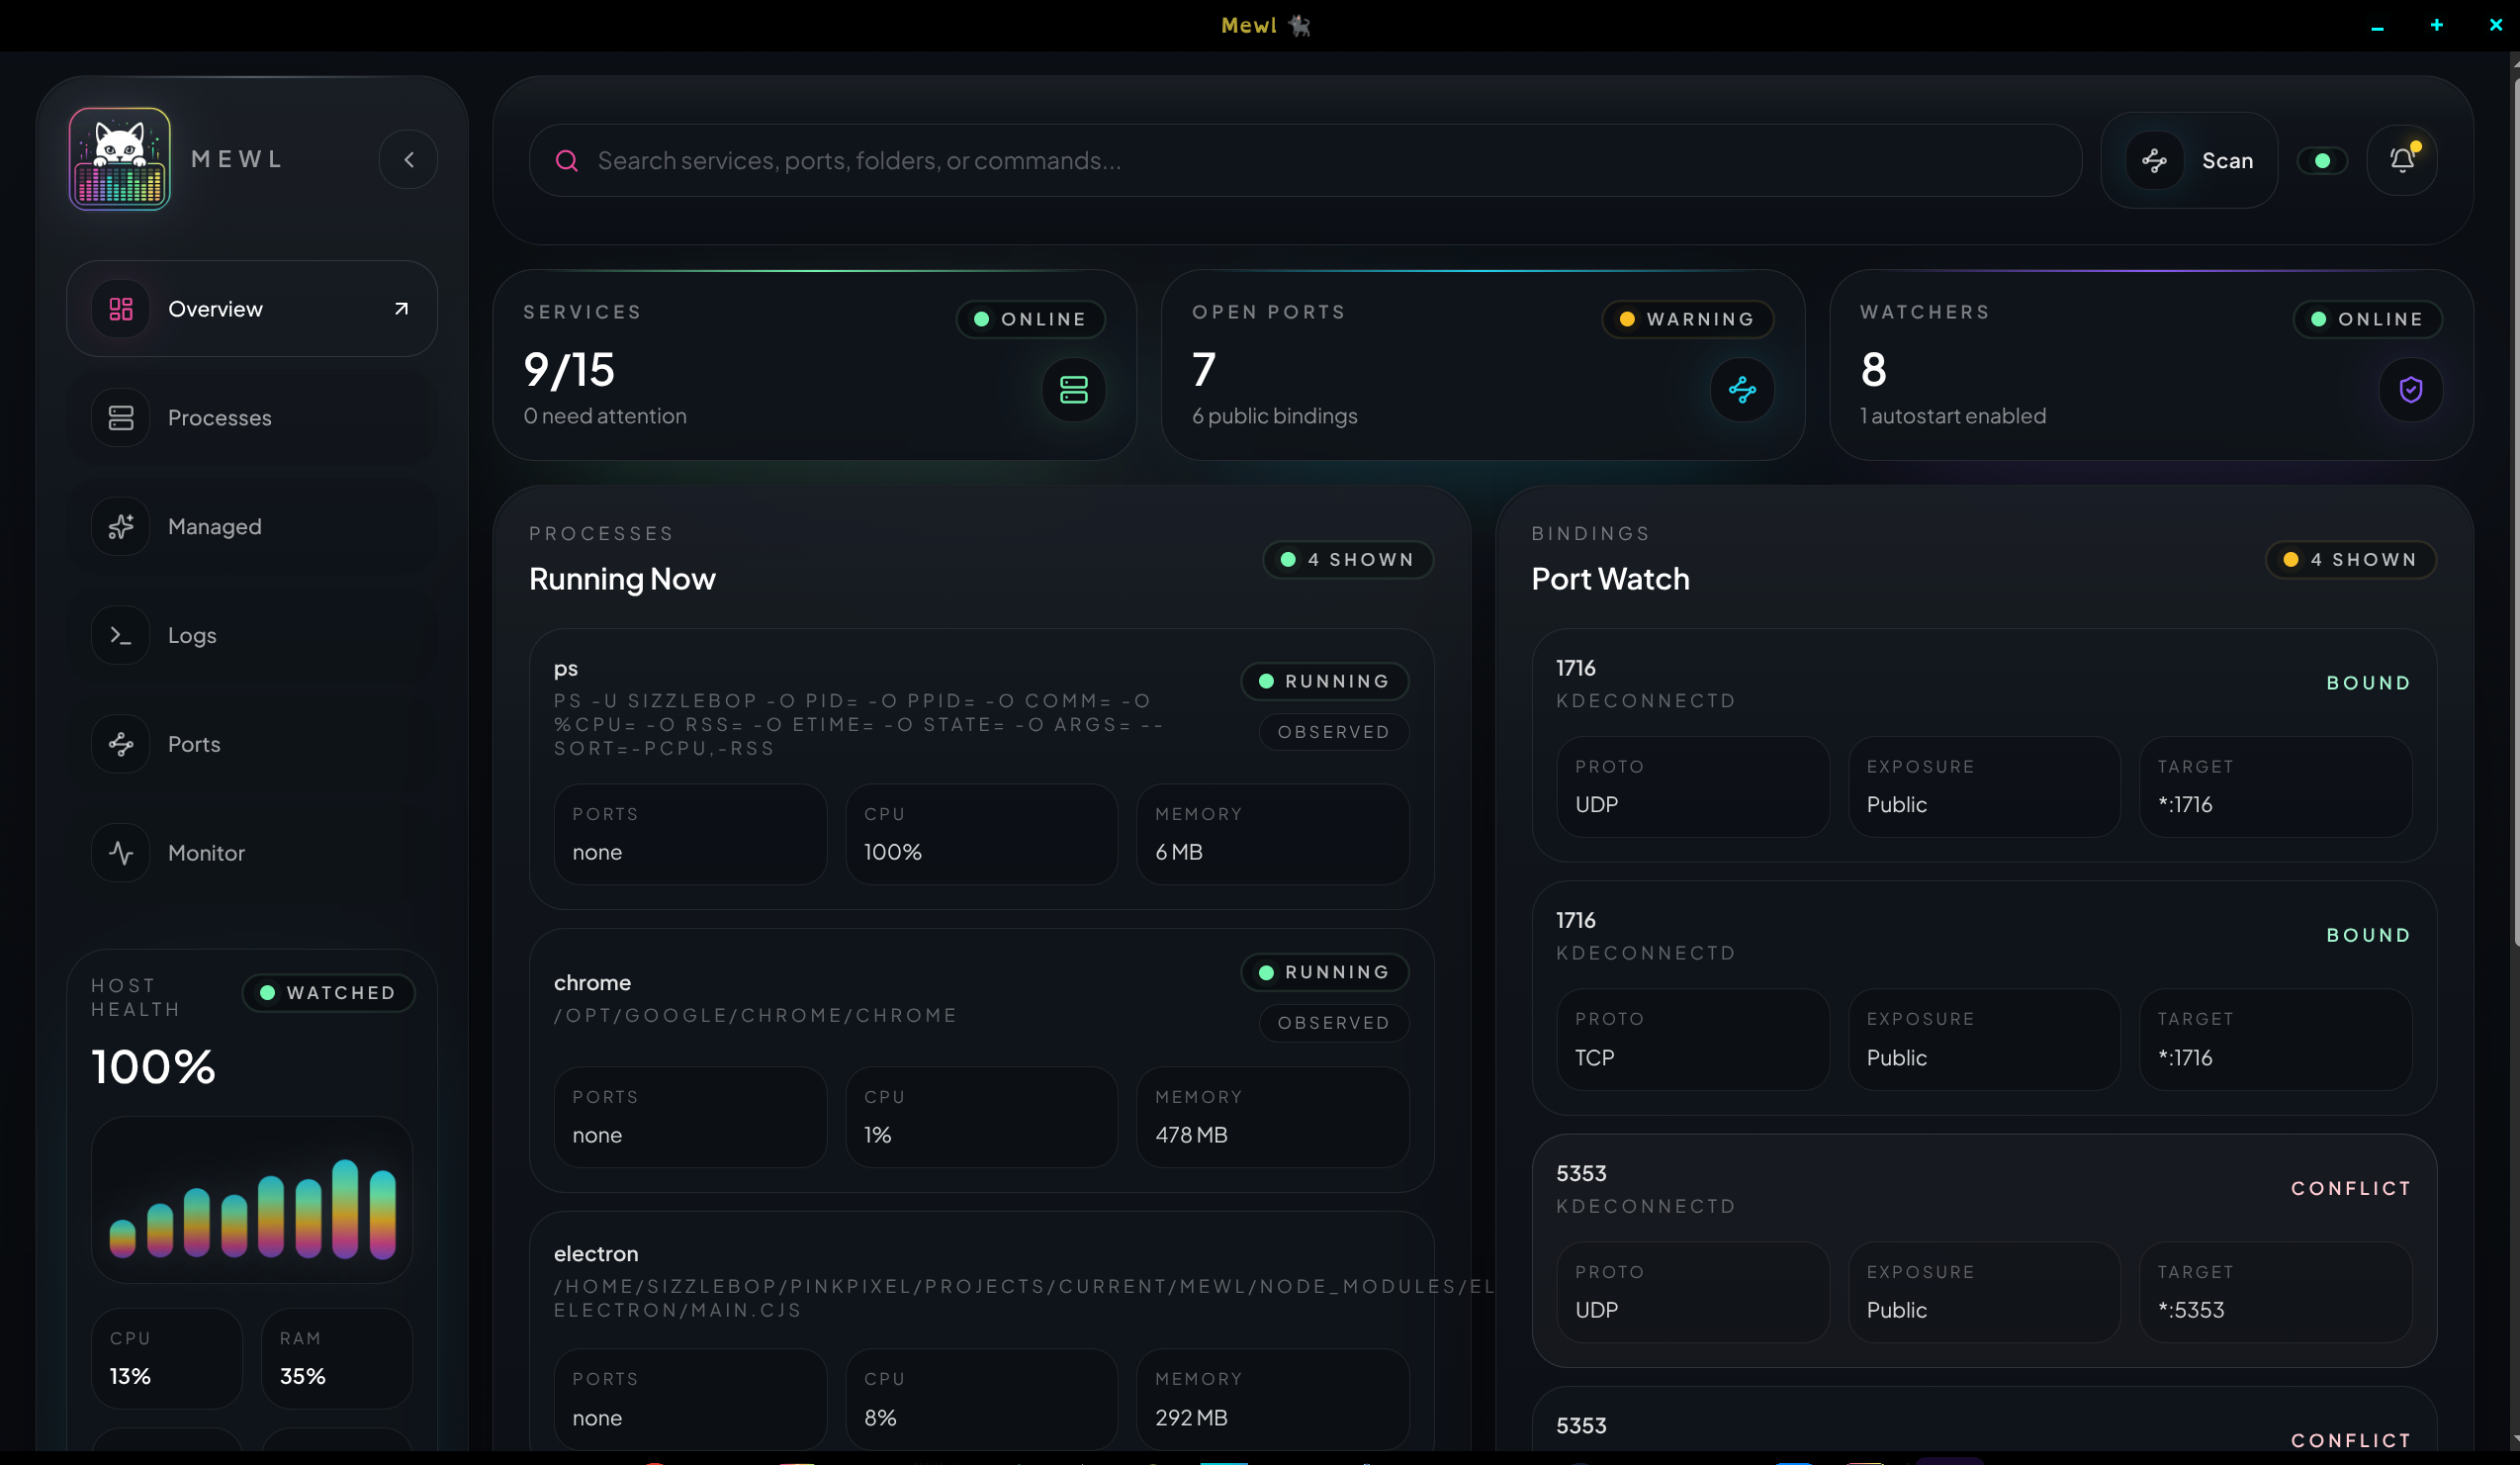
Overview
Section titled “Overview”The Overview page is the fastest place to orient yourself after opening Mewl.
Use it to:
- confirm the machine is healthy enough to work
- check summary counts for processes, ports, and incidents
- glance at running services without diving straight into detail
- jump into the full
ProcessesorPortsworkspaces with the contextual links
Think of this page as the landing view for triage, not the place where you do every detailed action.
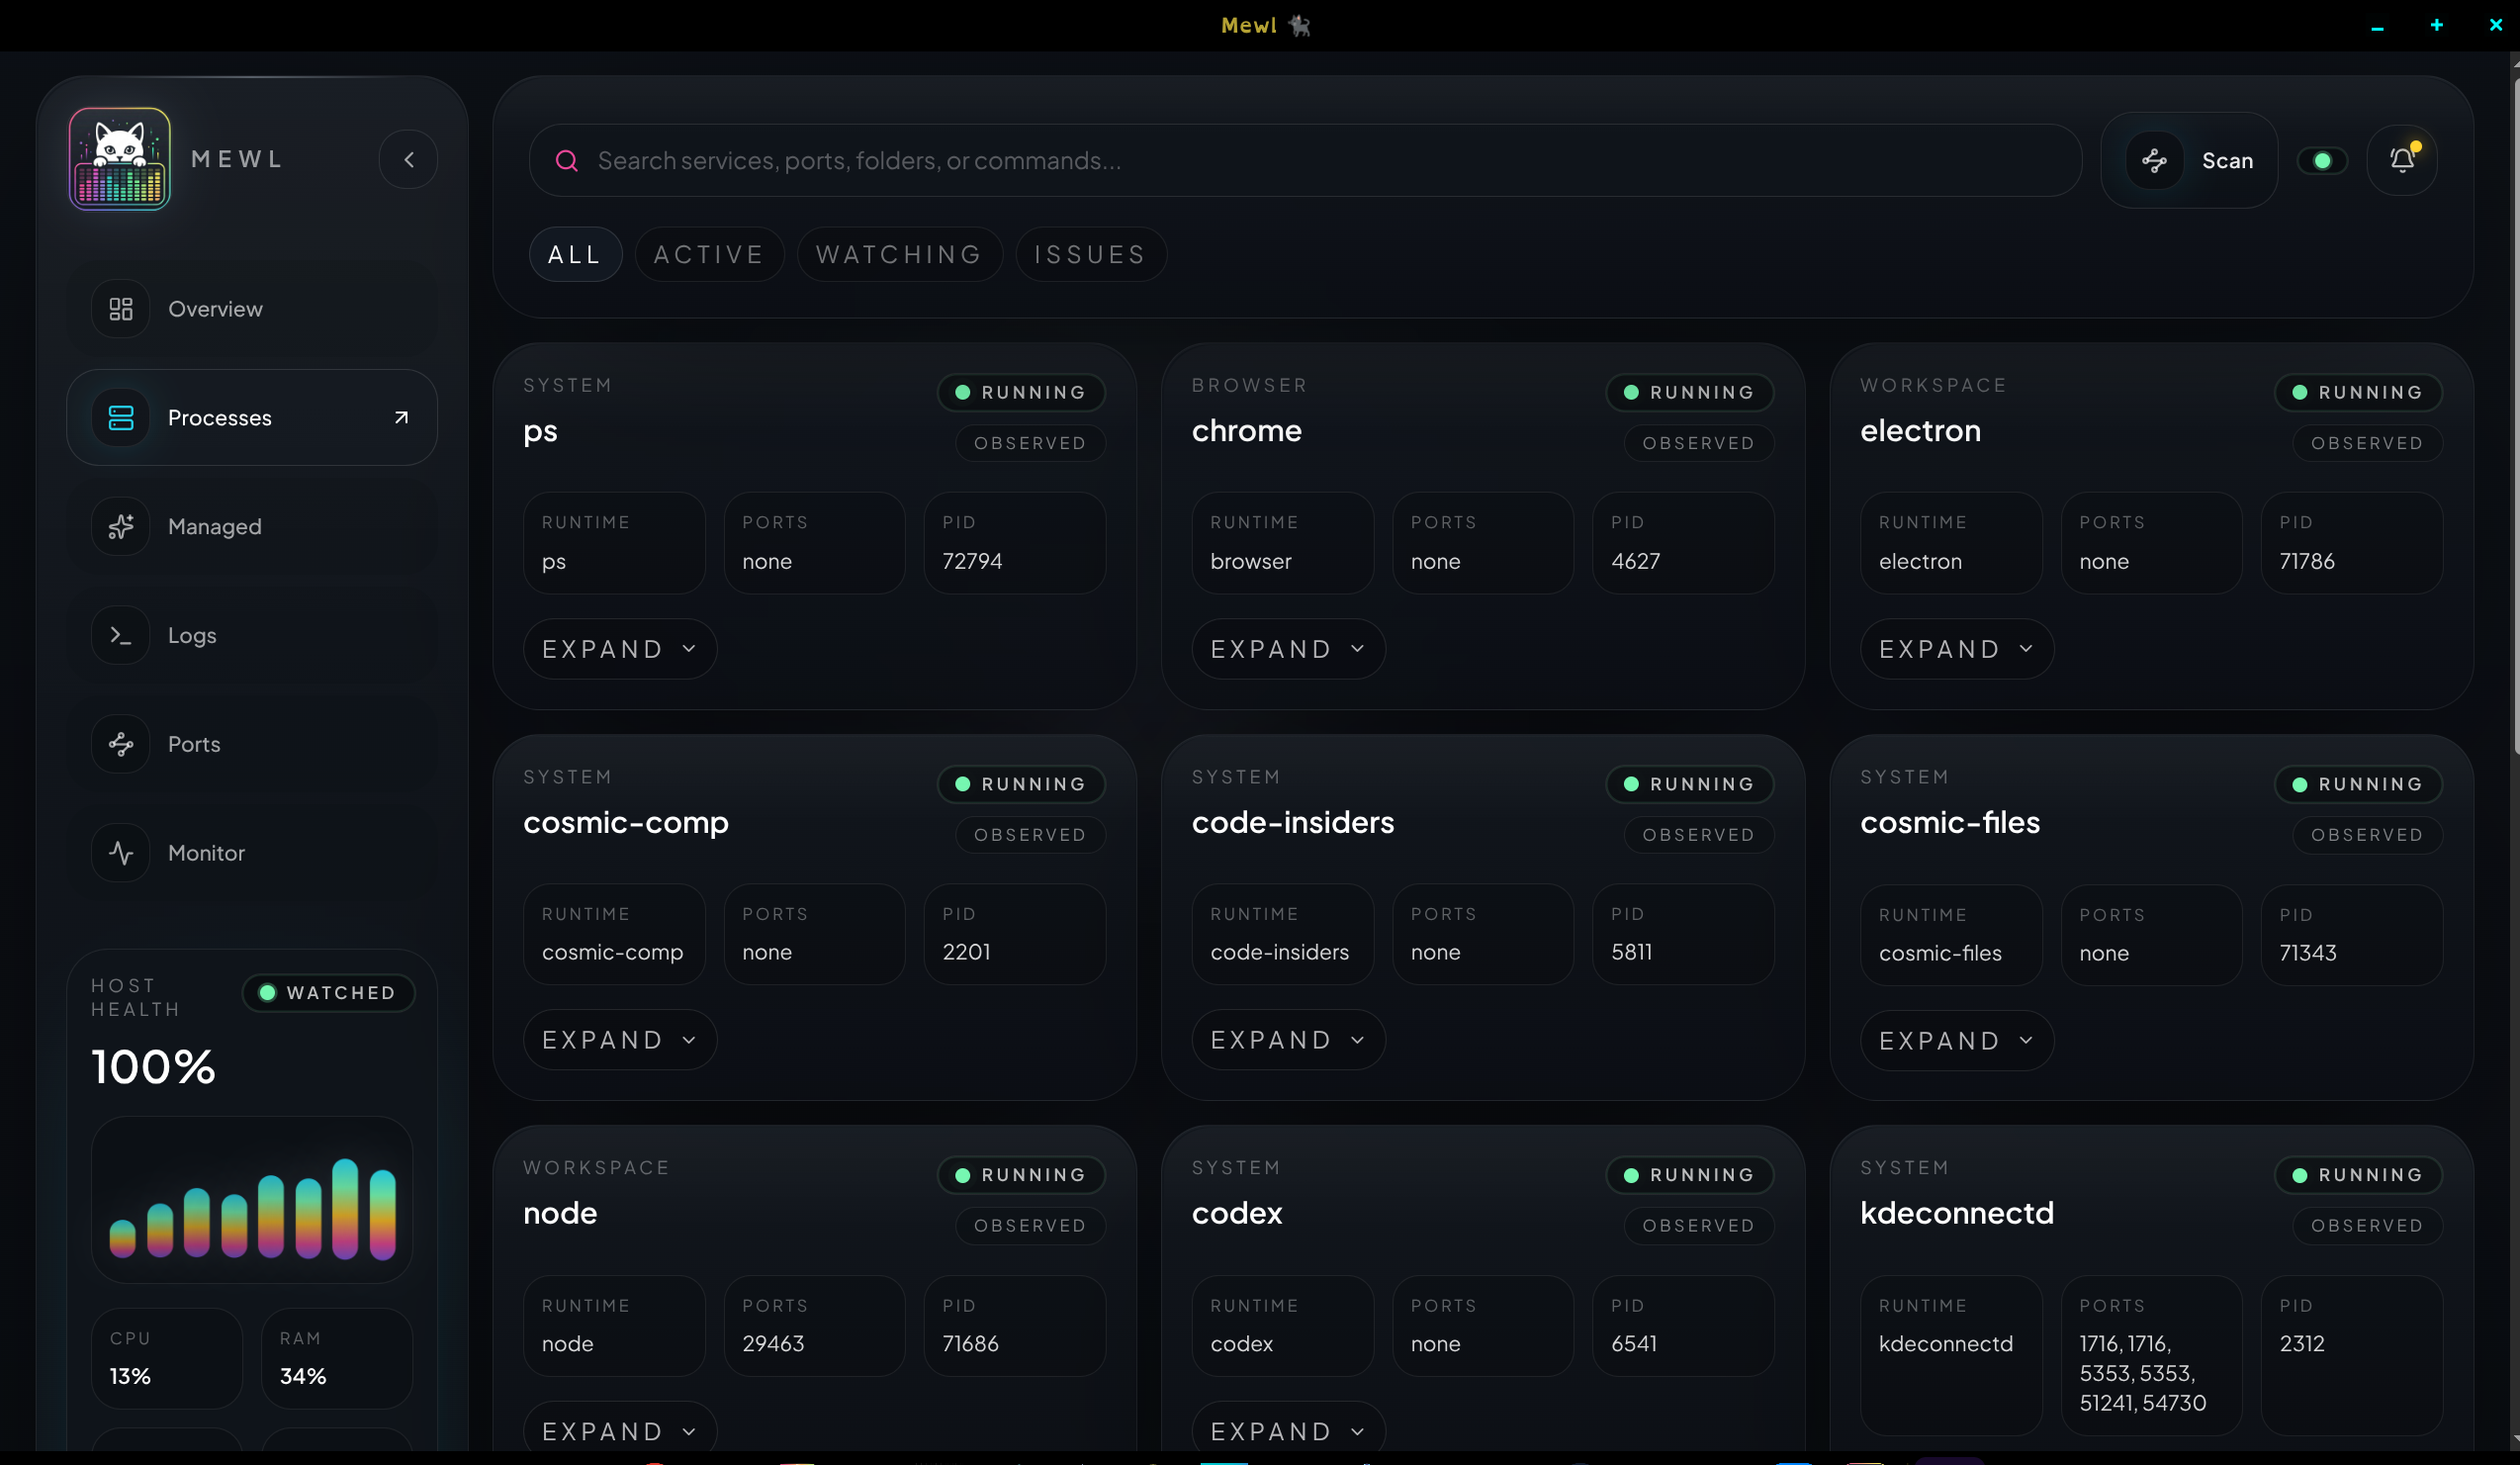
Processes
Section titled “Processes”The Processes workspace answers one question: what is running right now?
Each card is focused on live inspection. Expand a process when you need longer command details, working directory context, resource information, or recent output. If the process looks like something Mewl should own, create a managed draft from there instead of treating the observed row as the saved source of truth.
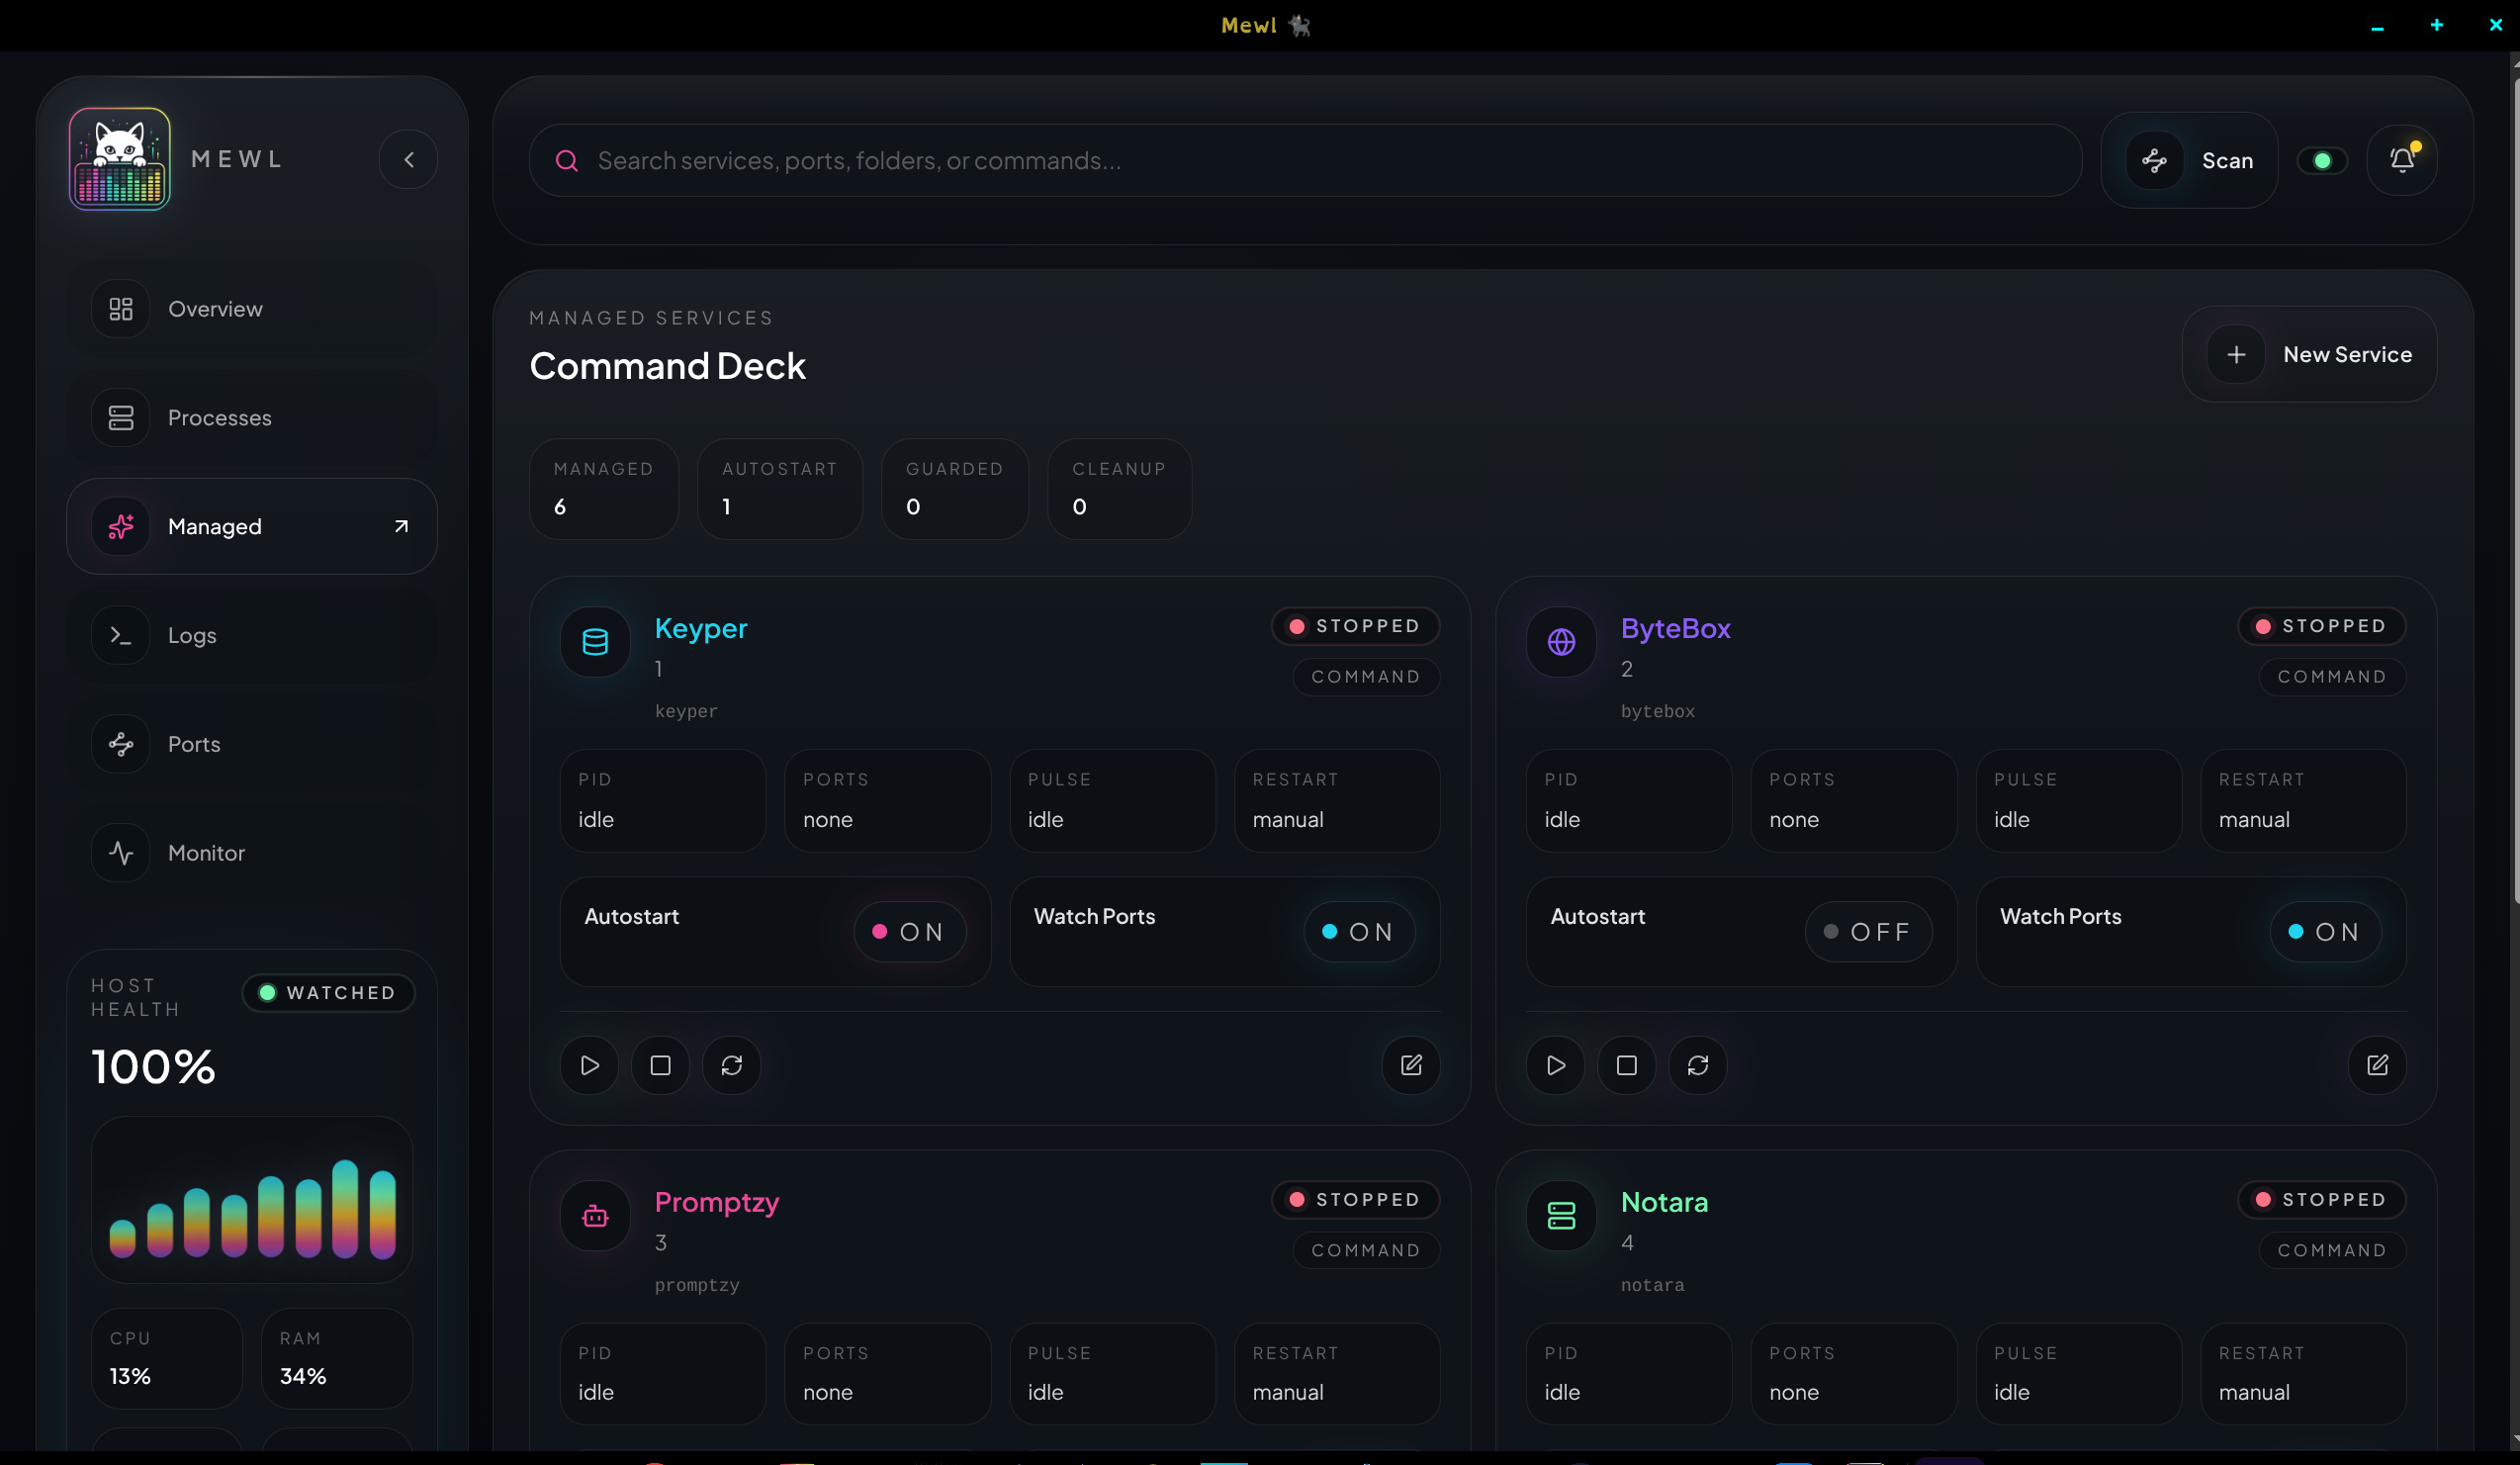
Managed
Section titled “Managed”The Managed workspace is where long-term control lives.
Open a card here when you want to:
- edit service metadata
- set a start, stop, or restart command
- review service notes
- toggle
autostart - toggle
watch ports - run lifecycle actions directly from the card
This page is intentionally denser than Processes because it is meant for service ownership, not passive observation.
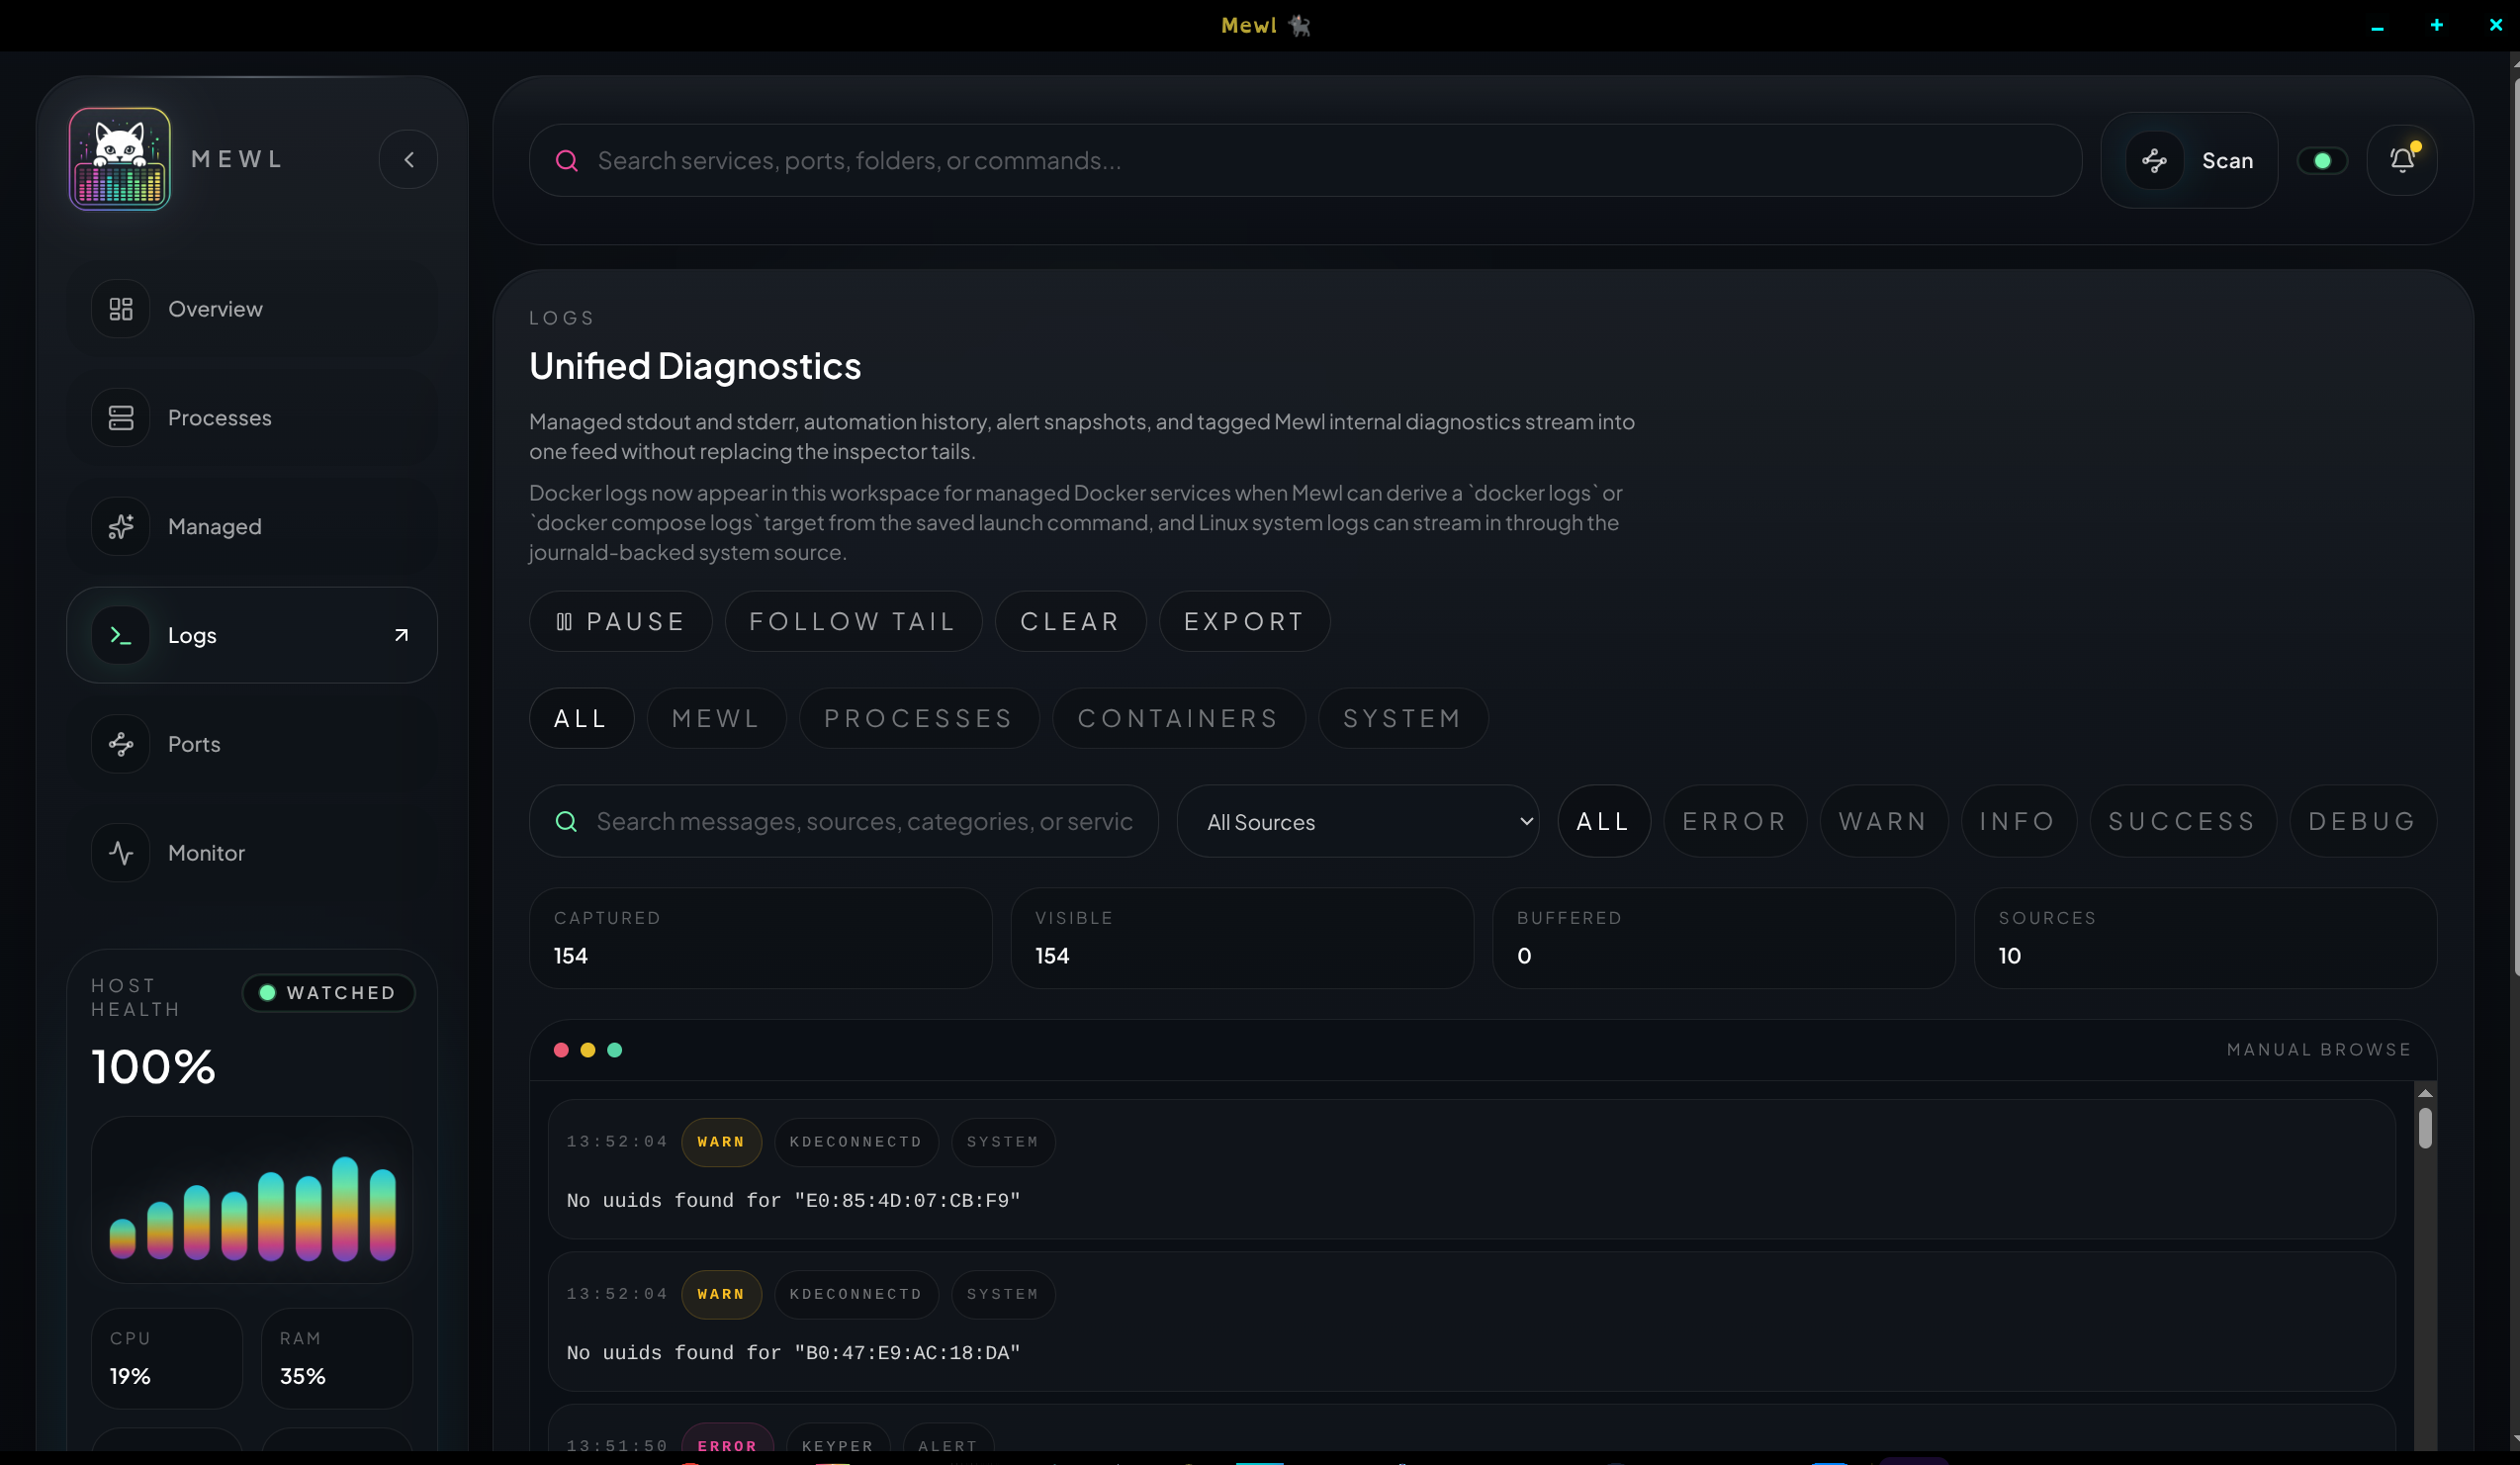
The Logs workspace is the central debugging feed.
Move here when something behaves unexpectedly, restarts too often, binds the wrong port, or emits errors you need to filter quickly. The source tabs help you narrow by Mewl internals, managed processes, containers, or Linux system logs without leaving the unified stream model.
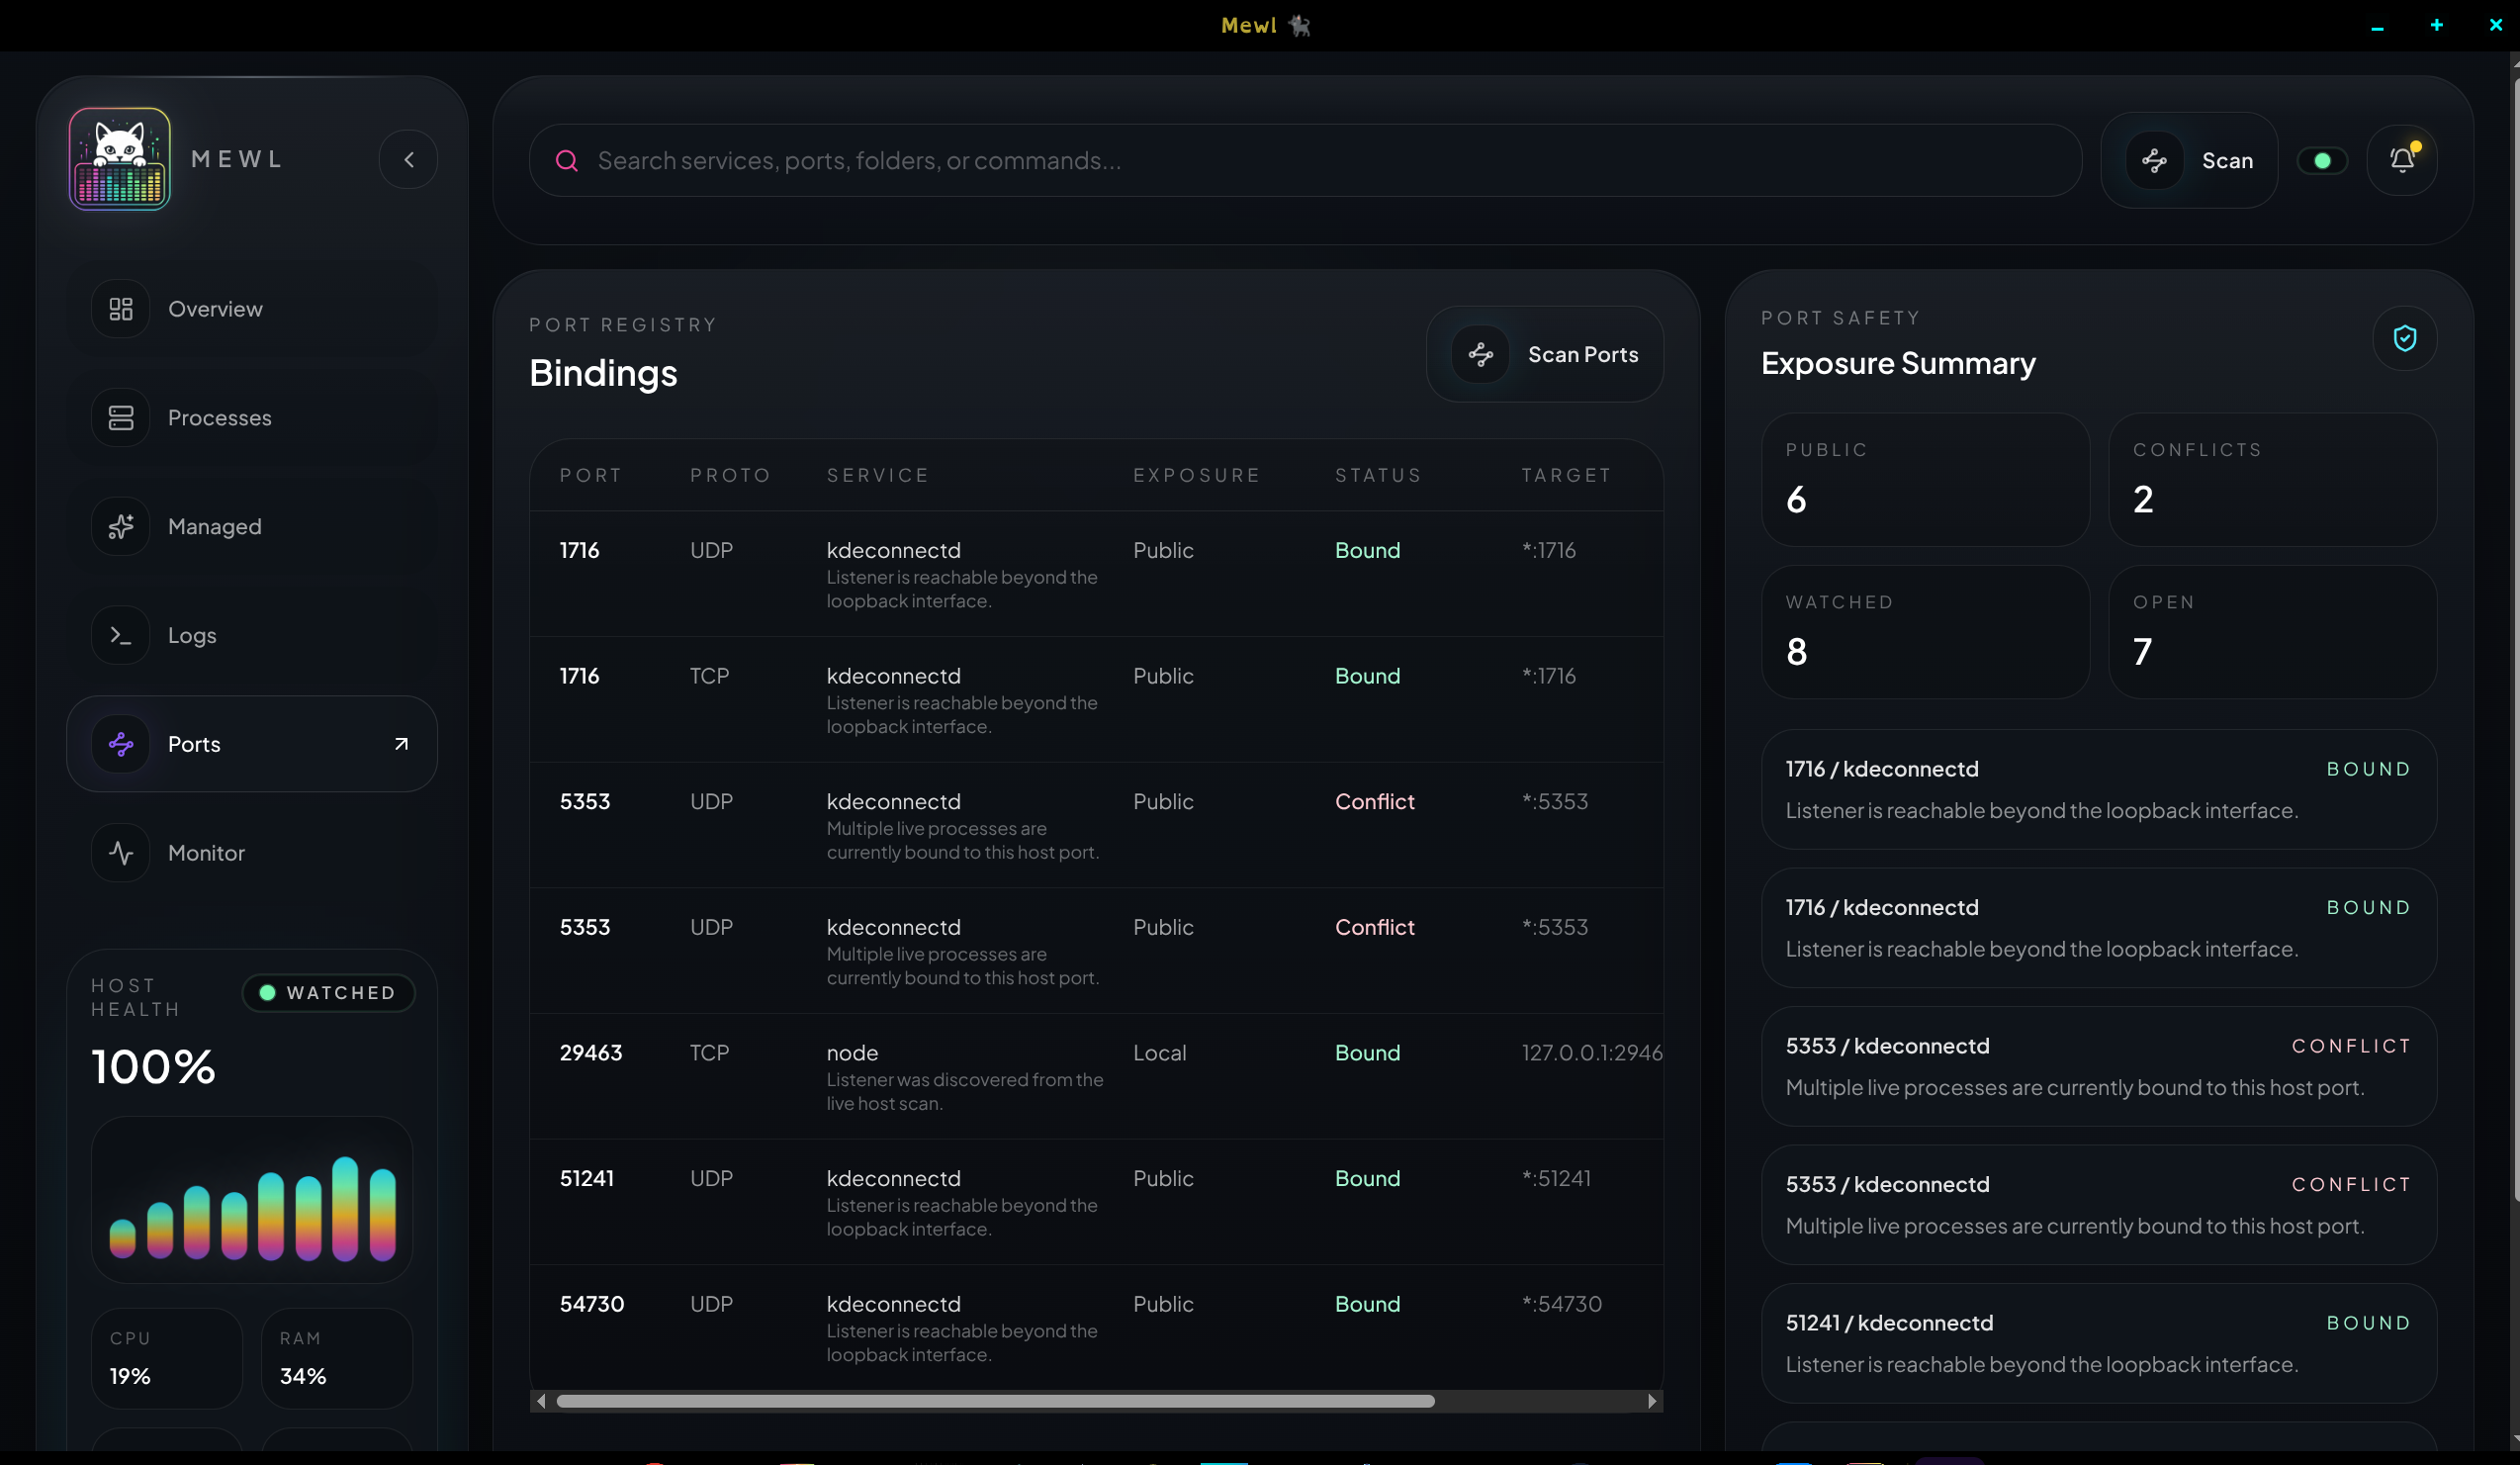
The Ports workspace helps you understand what is bound, what is exposed, and what is colliding.
Use it when:
- a service will not start because a port is already taken
- you need to confirm which process owns a binding
- you want to compare watched ports against current runtime reality
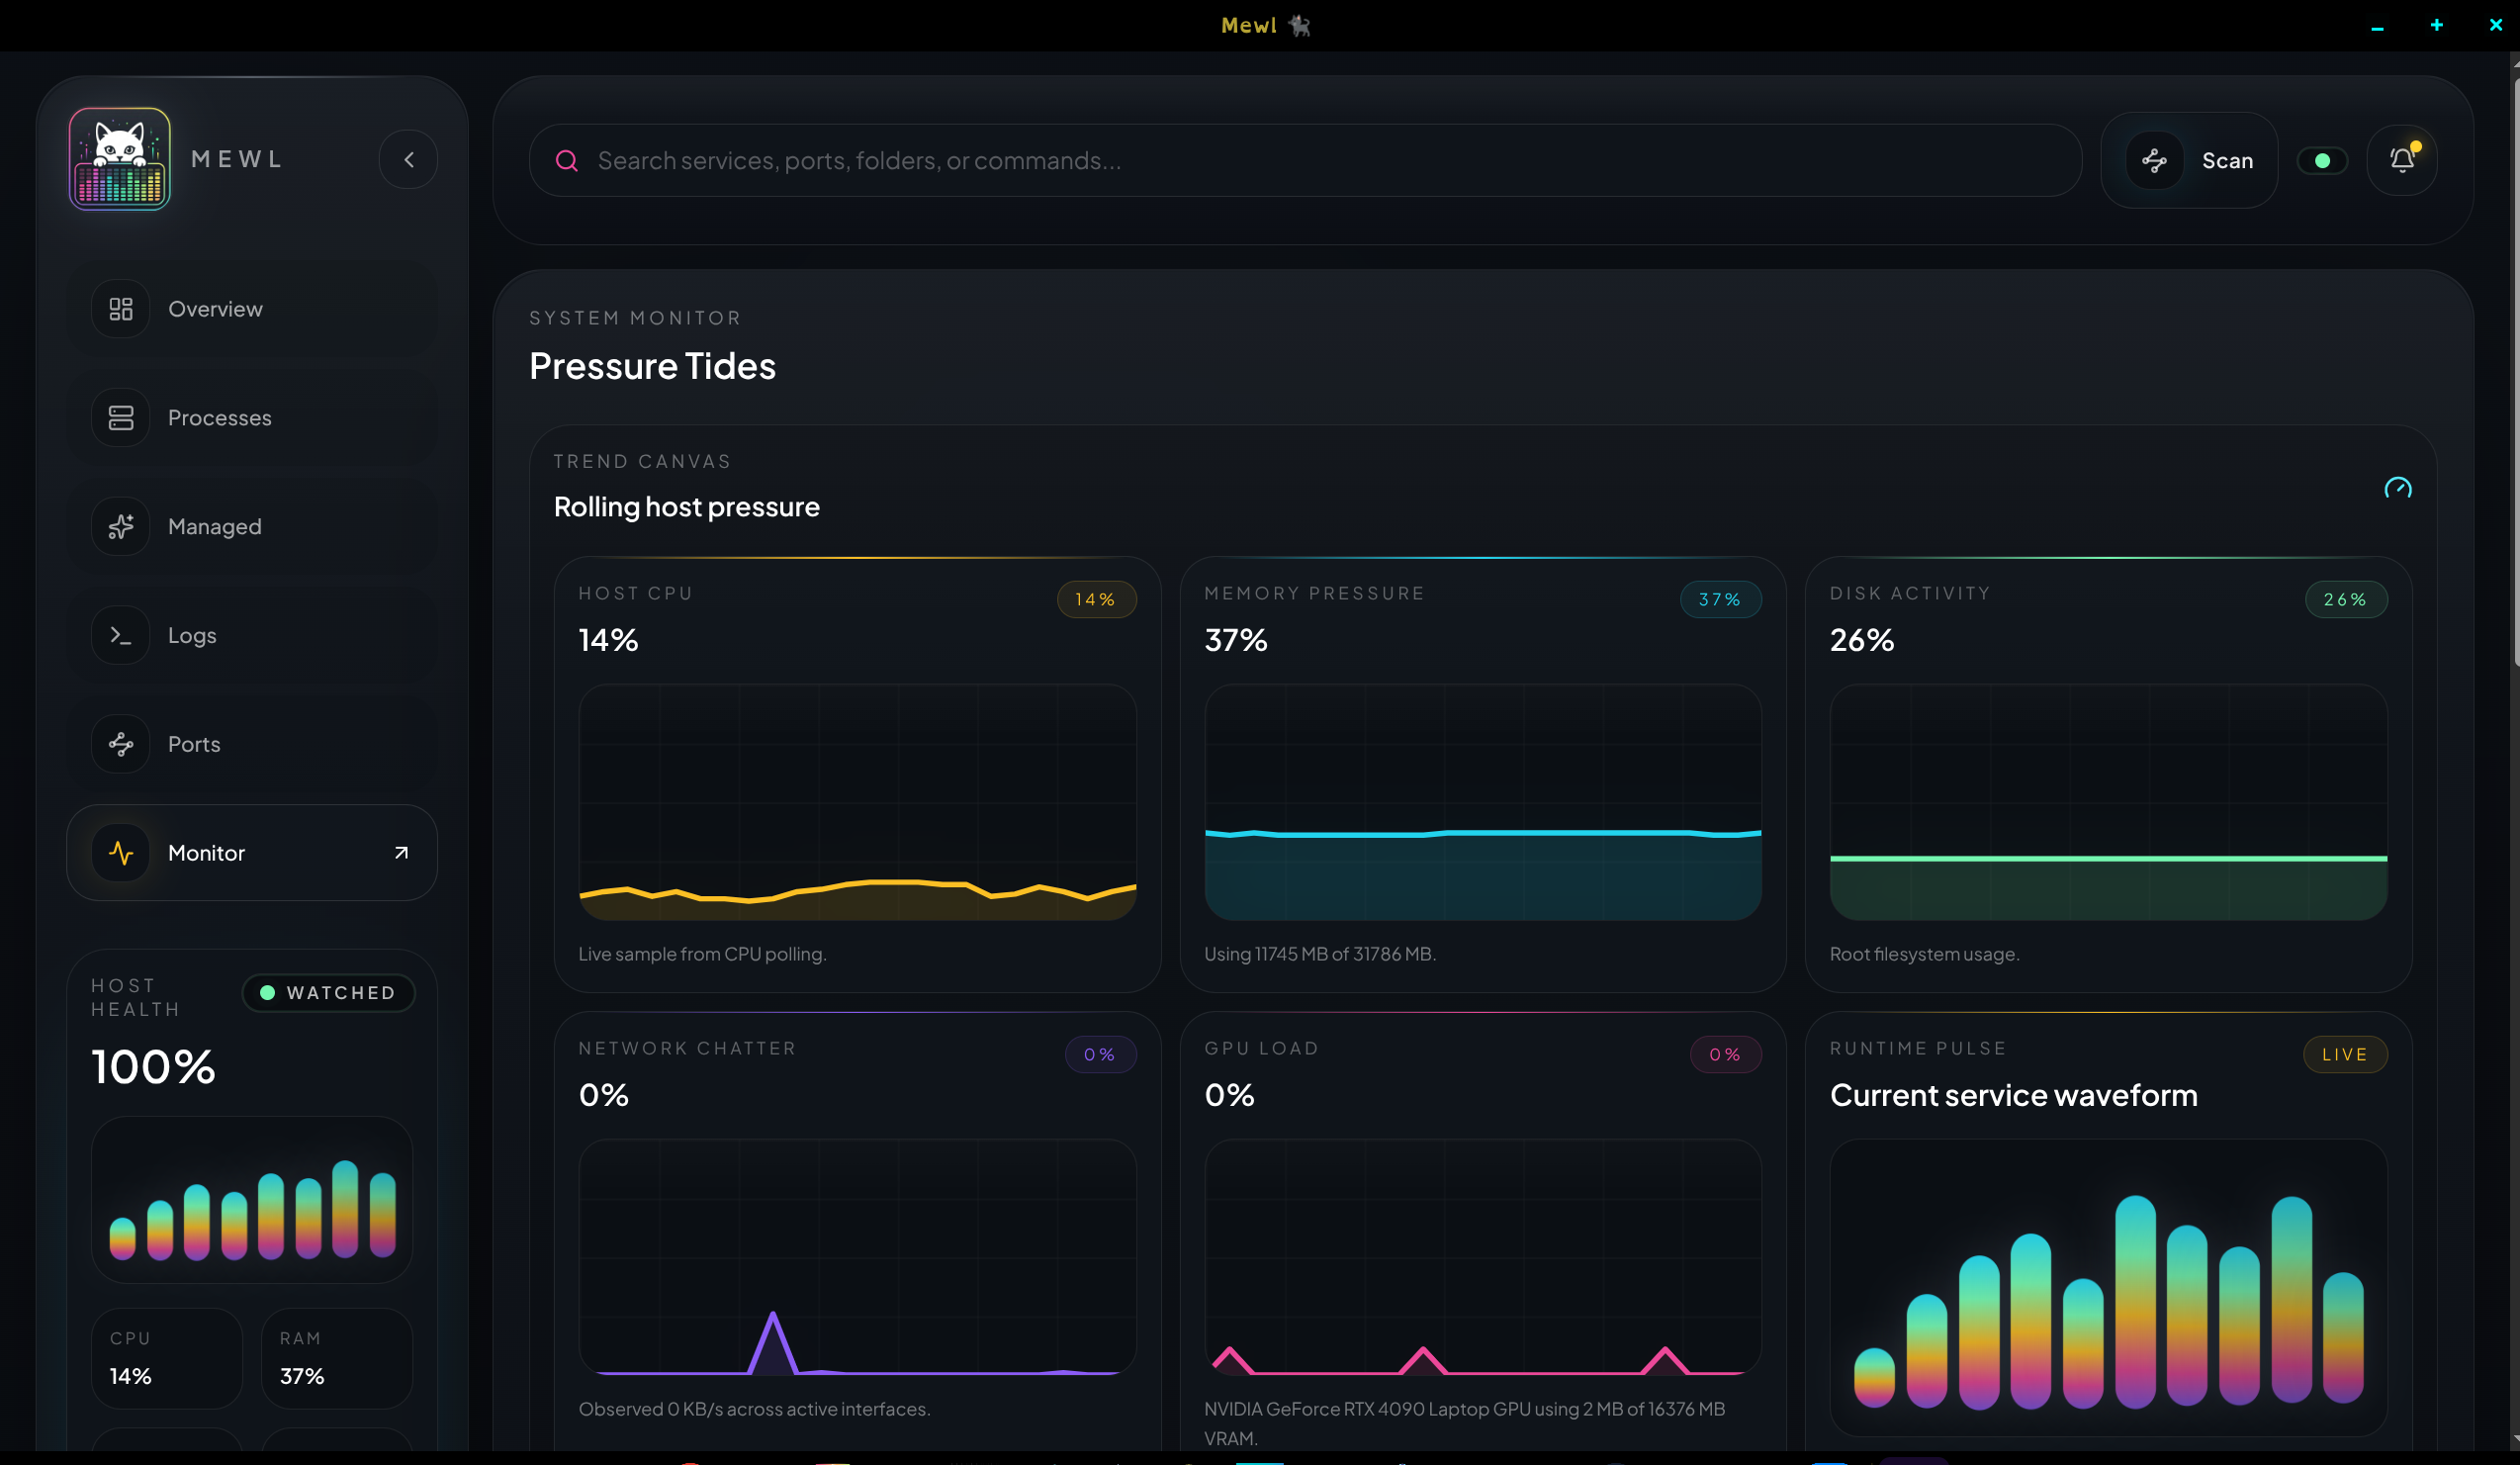
Monitor
Section titled “Monitor”The Monitor workspace is for host pressure and change over time.
This is the page to open when the machine feels slow, a service is behaving erratically under load, or you need to understand whether CPU, memory, disk, network, or GPU pressure lines up with an incident.