Logs and monitoring
Unified diagnostics
Section titled “Unified diagnostics”The Logs workspace is designed to answer one question quickly: what changed, and should I care?
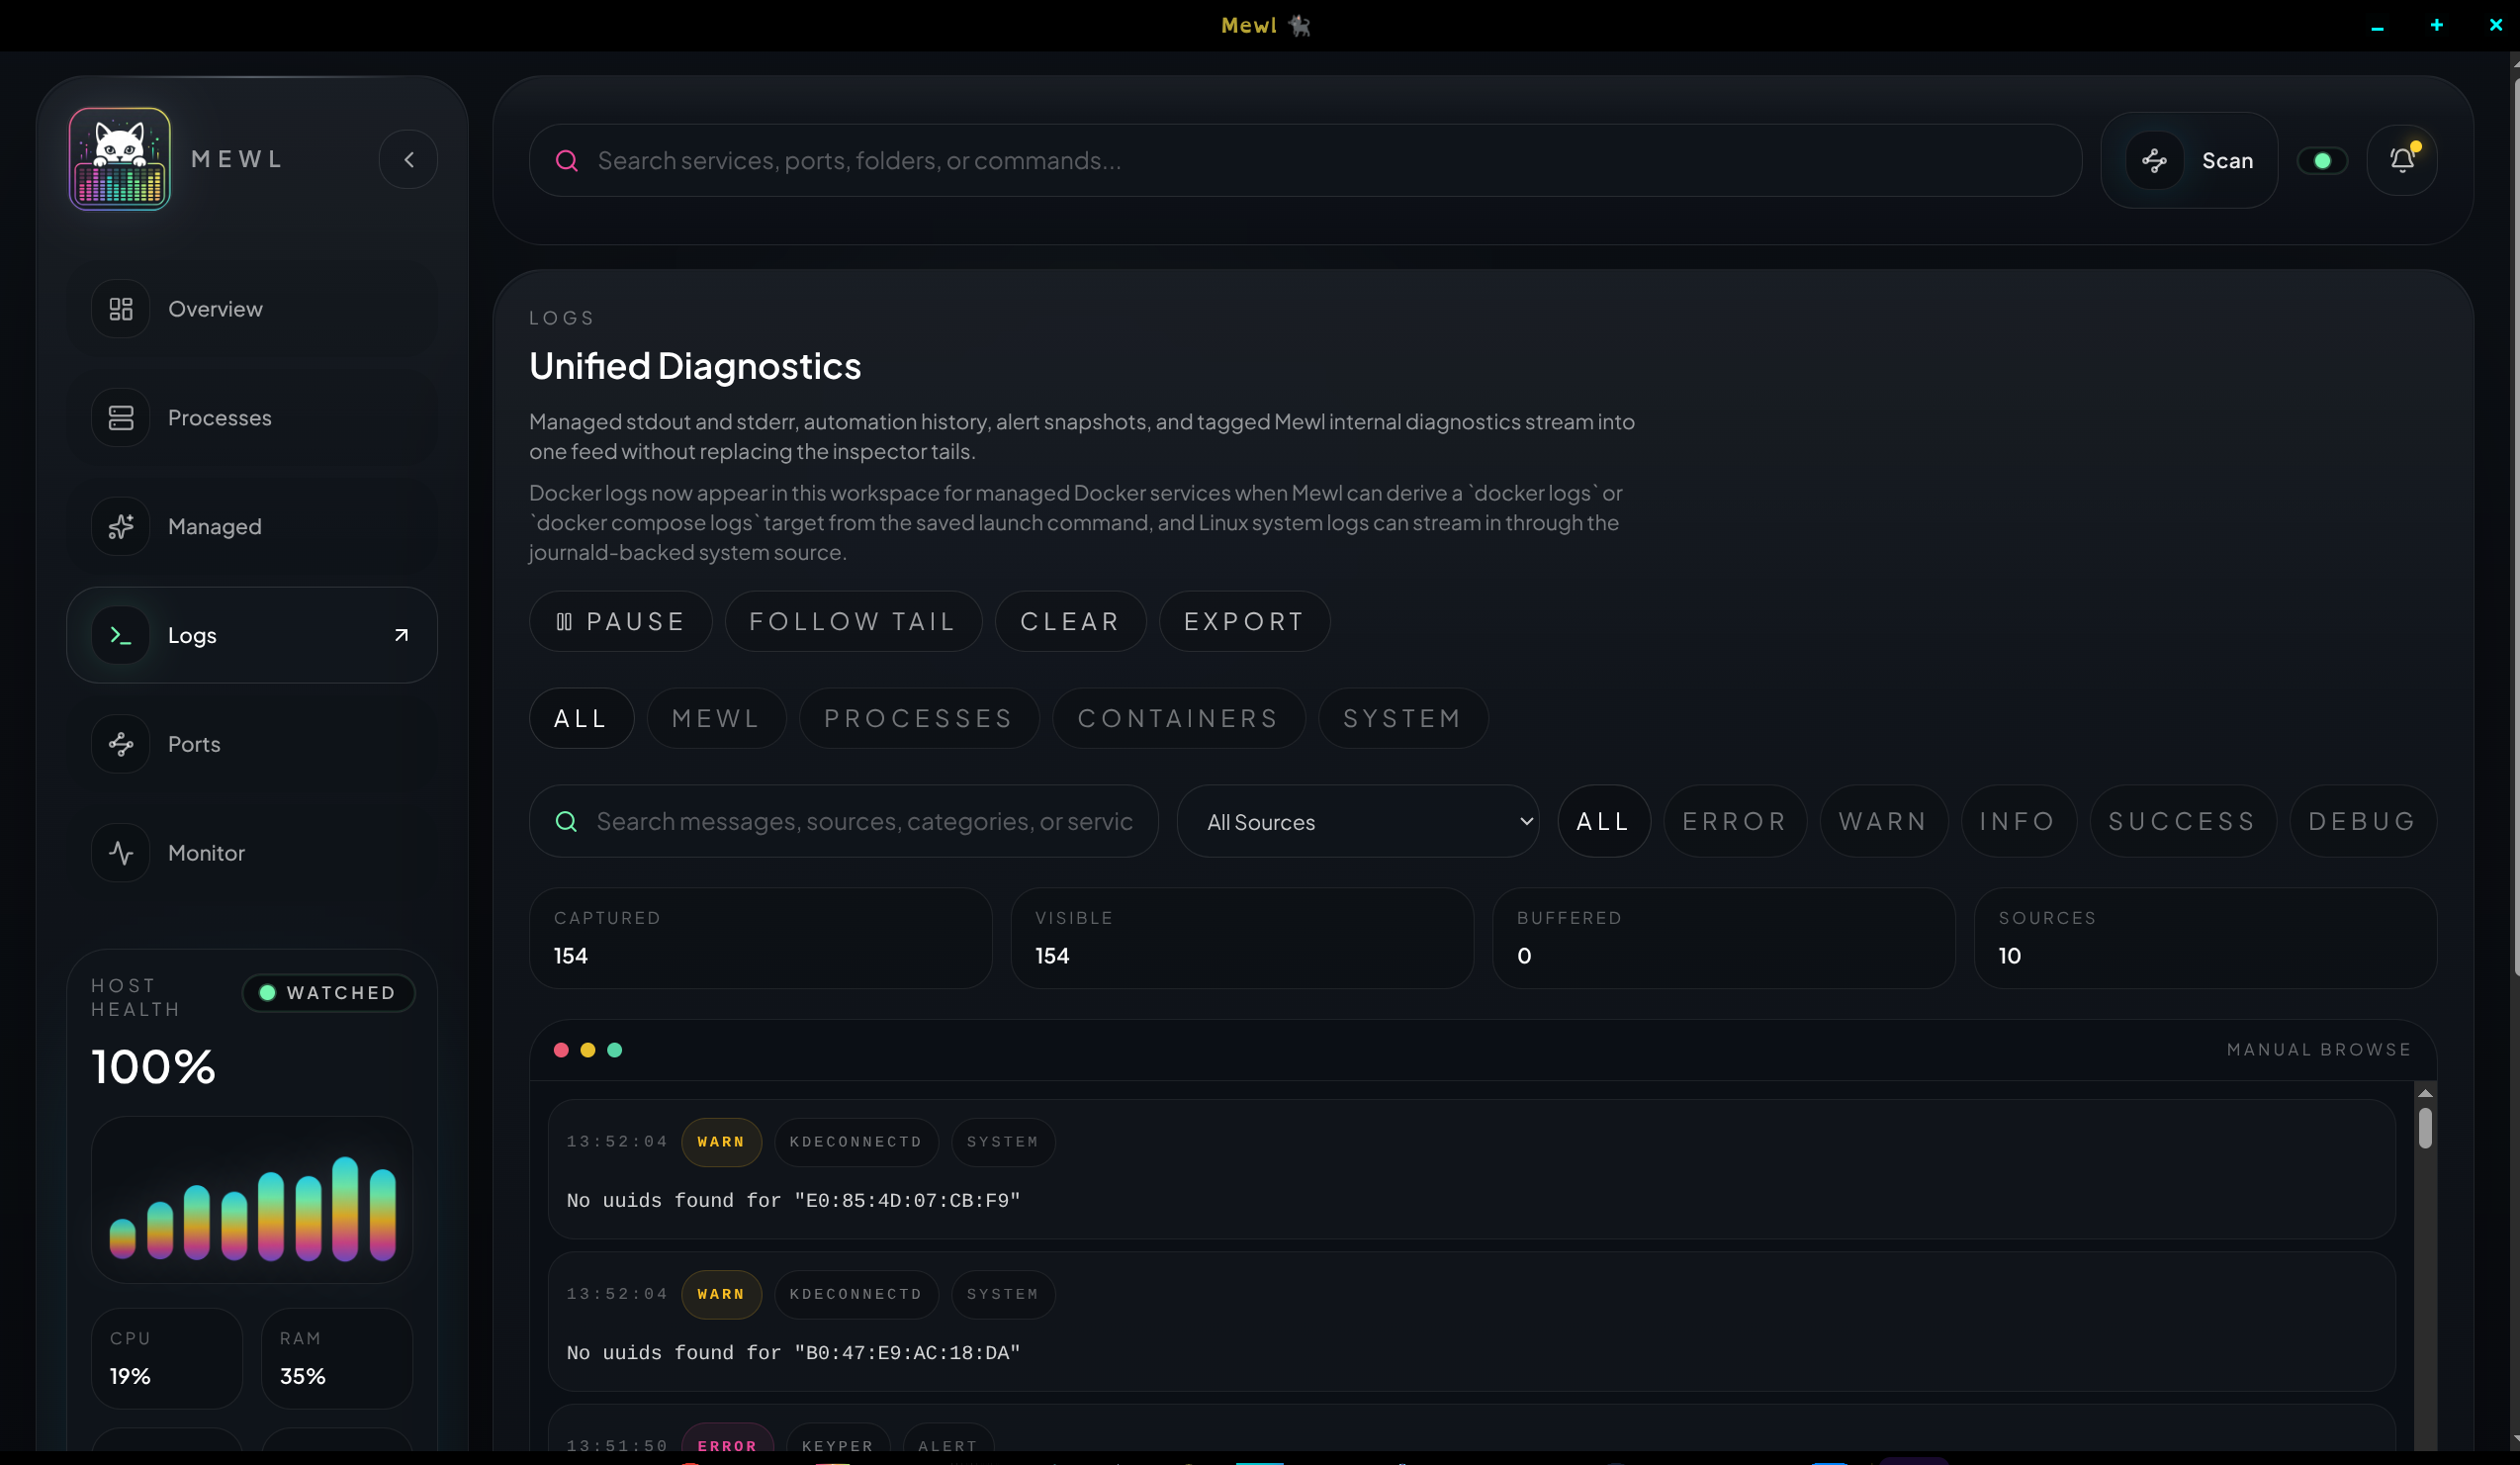
Mewl aggregates multiple sources into one stream:
- internal Mewl logs powered by
consola - managed stdout and stderr
- automation history events
- alert snapshots
- container logs for compatible Docker flows
- journald-backed Linux system logs
Filtering model
Section titled “Filtering model”You can narrow the feed by:
- search text
- severity
- source tab
- follow-tail state
That keeps long sessions usable without giving up the unified feed model.
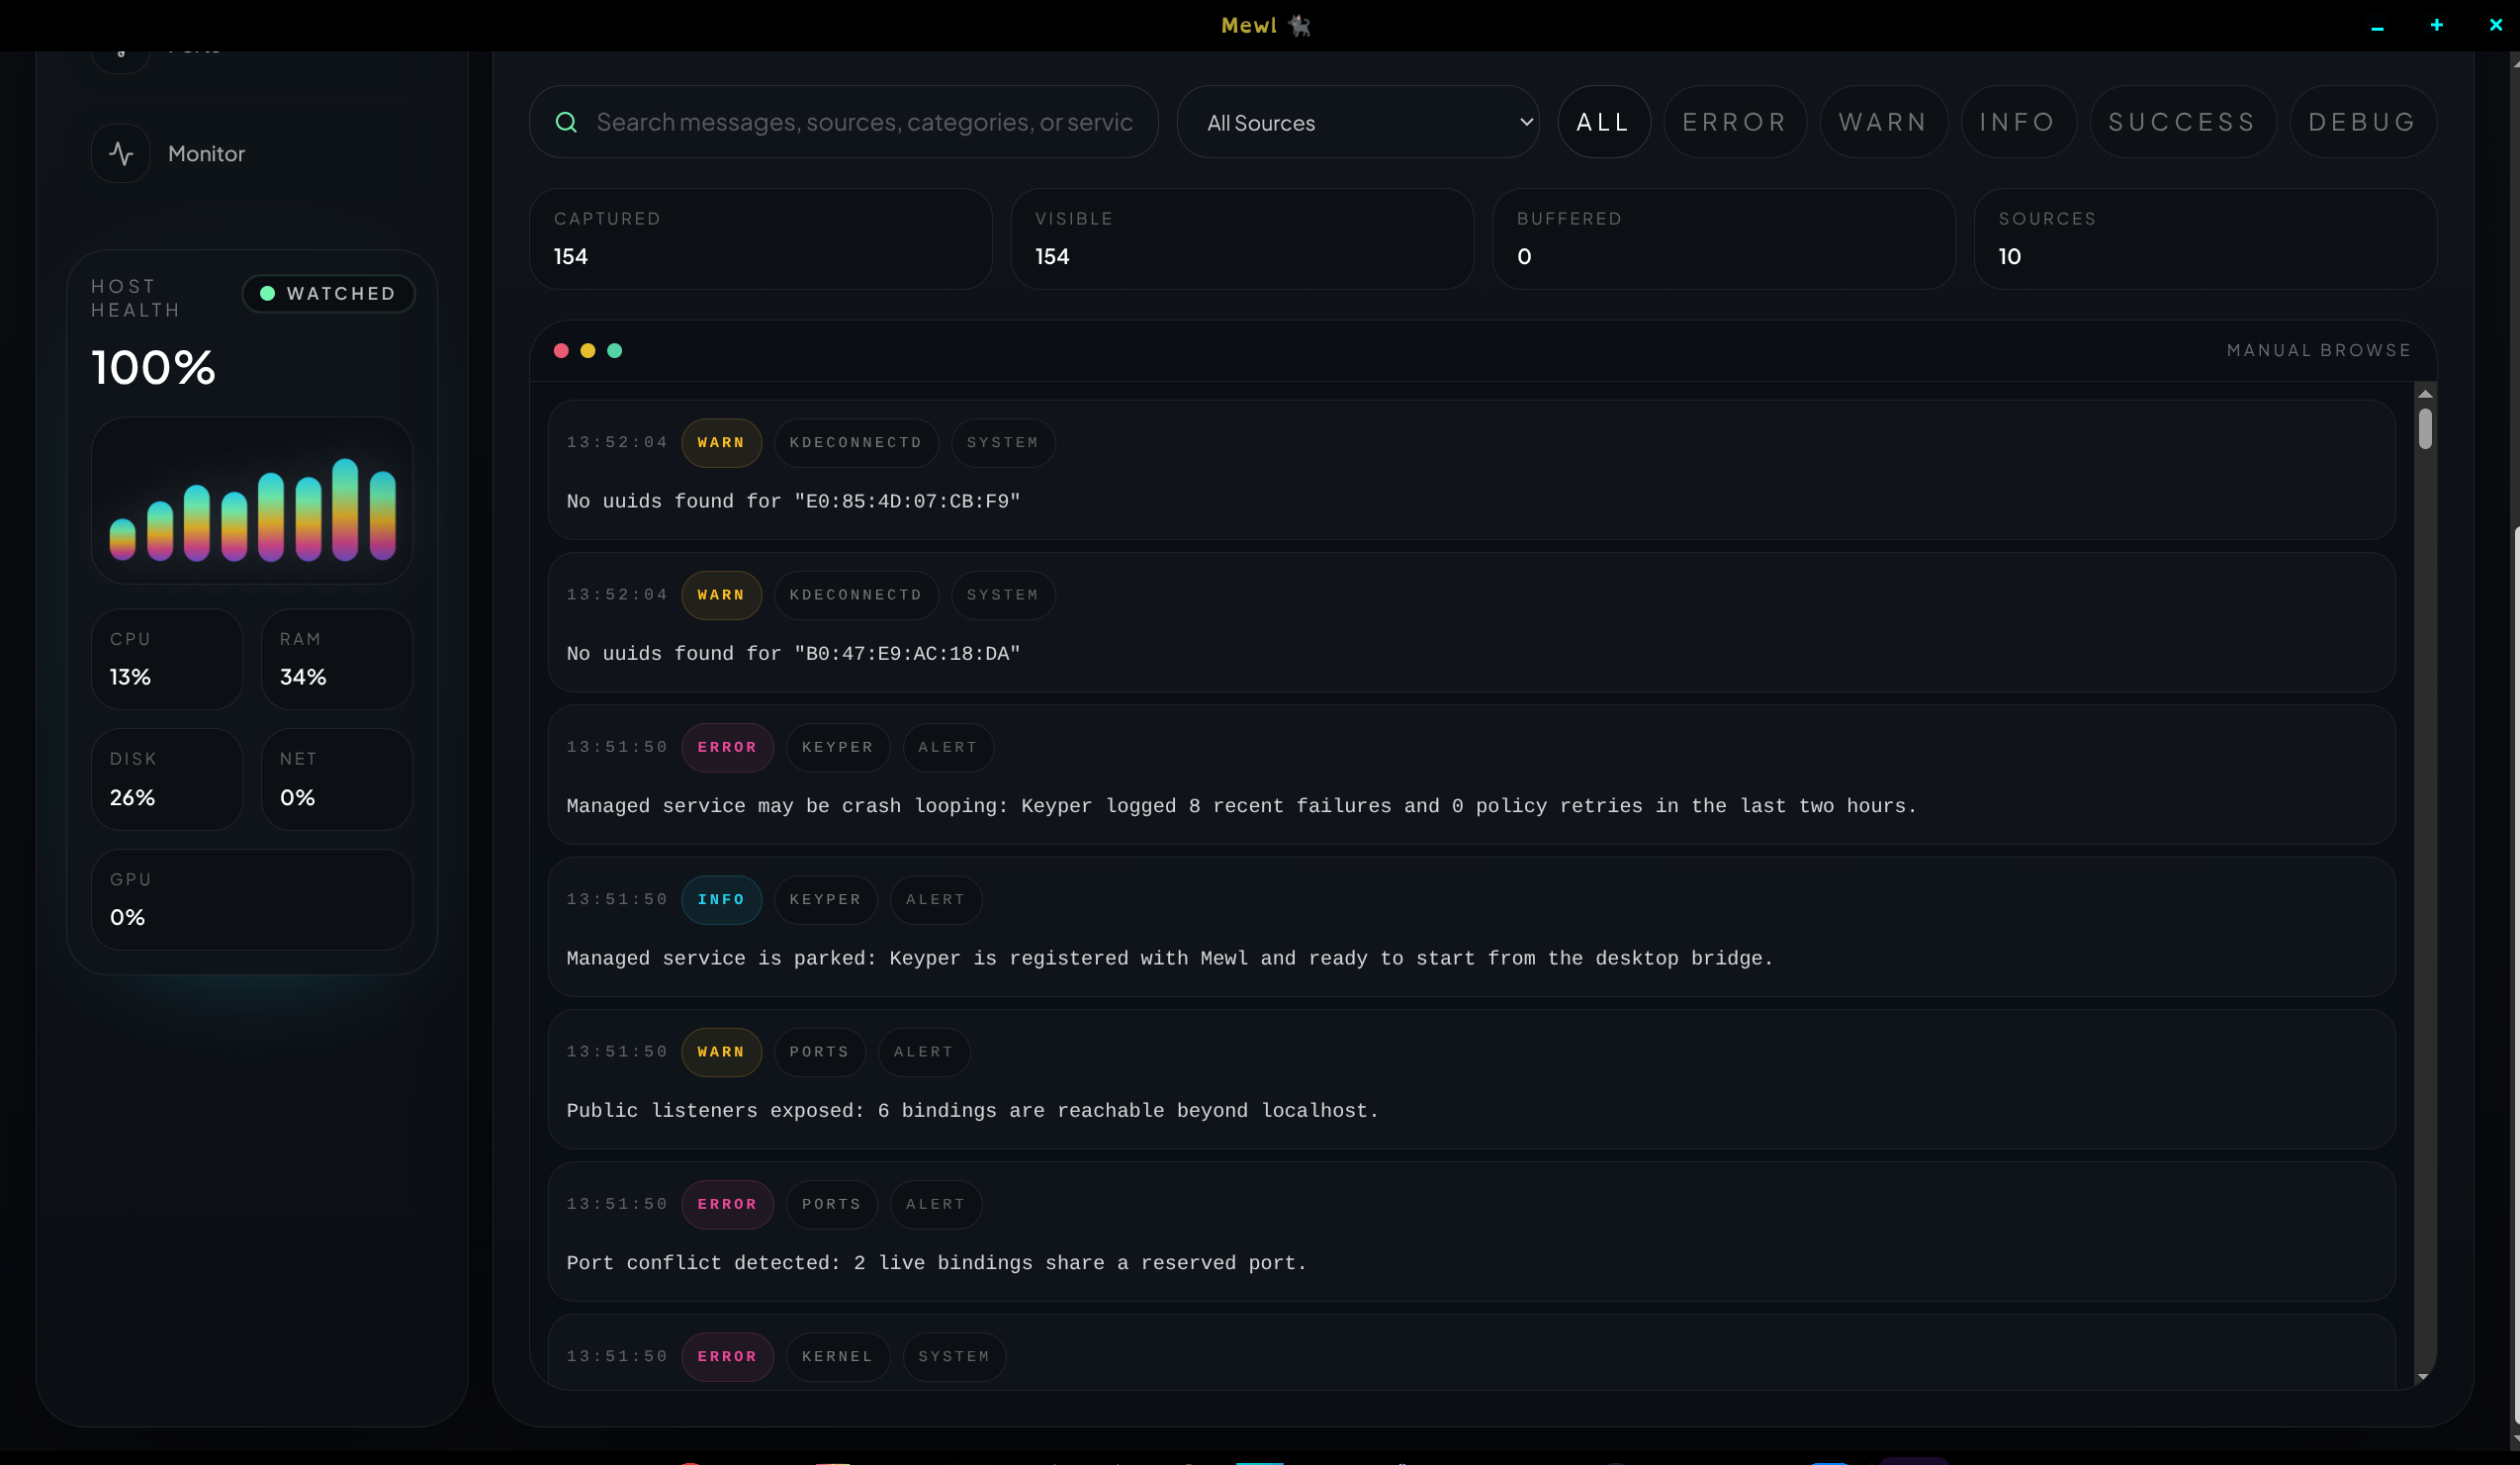
The usual rhythm is:
- start broad in
All - narrow by source tab
- filter by severity or text
- pause the UI view if the feed is moving too quickly
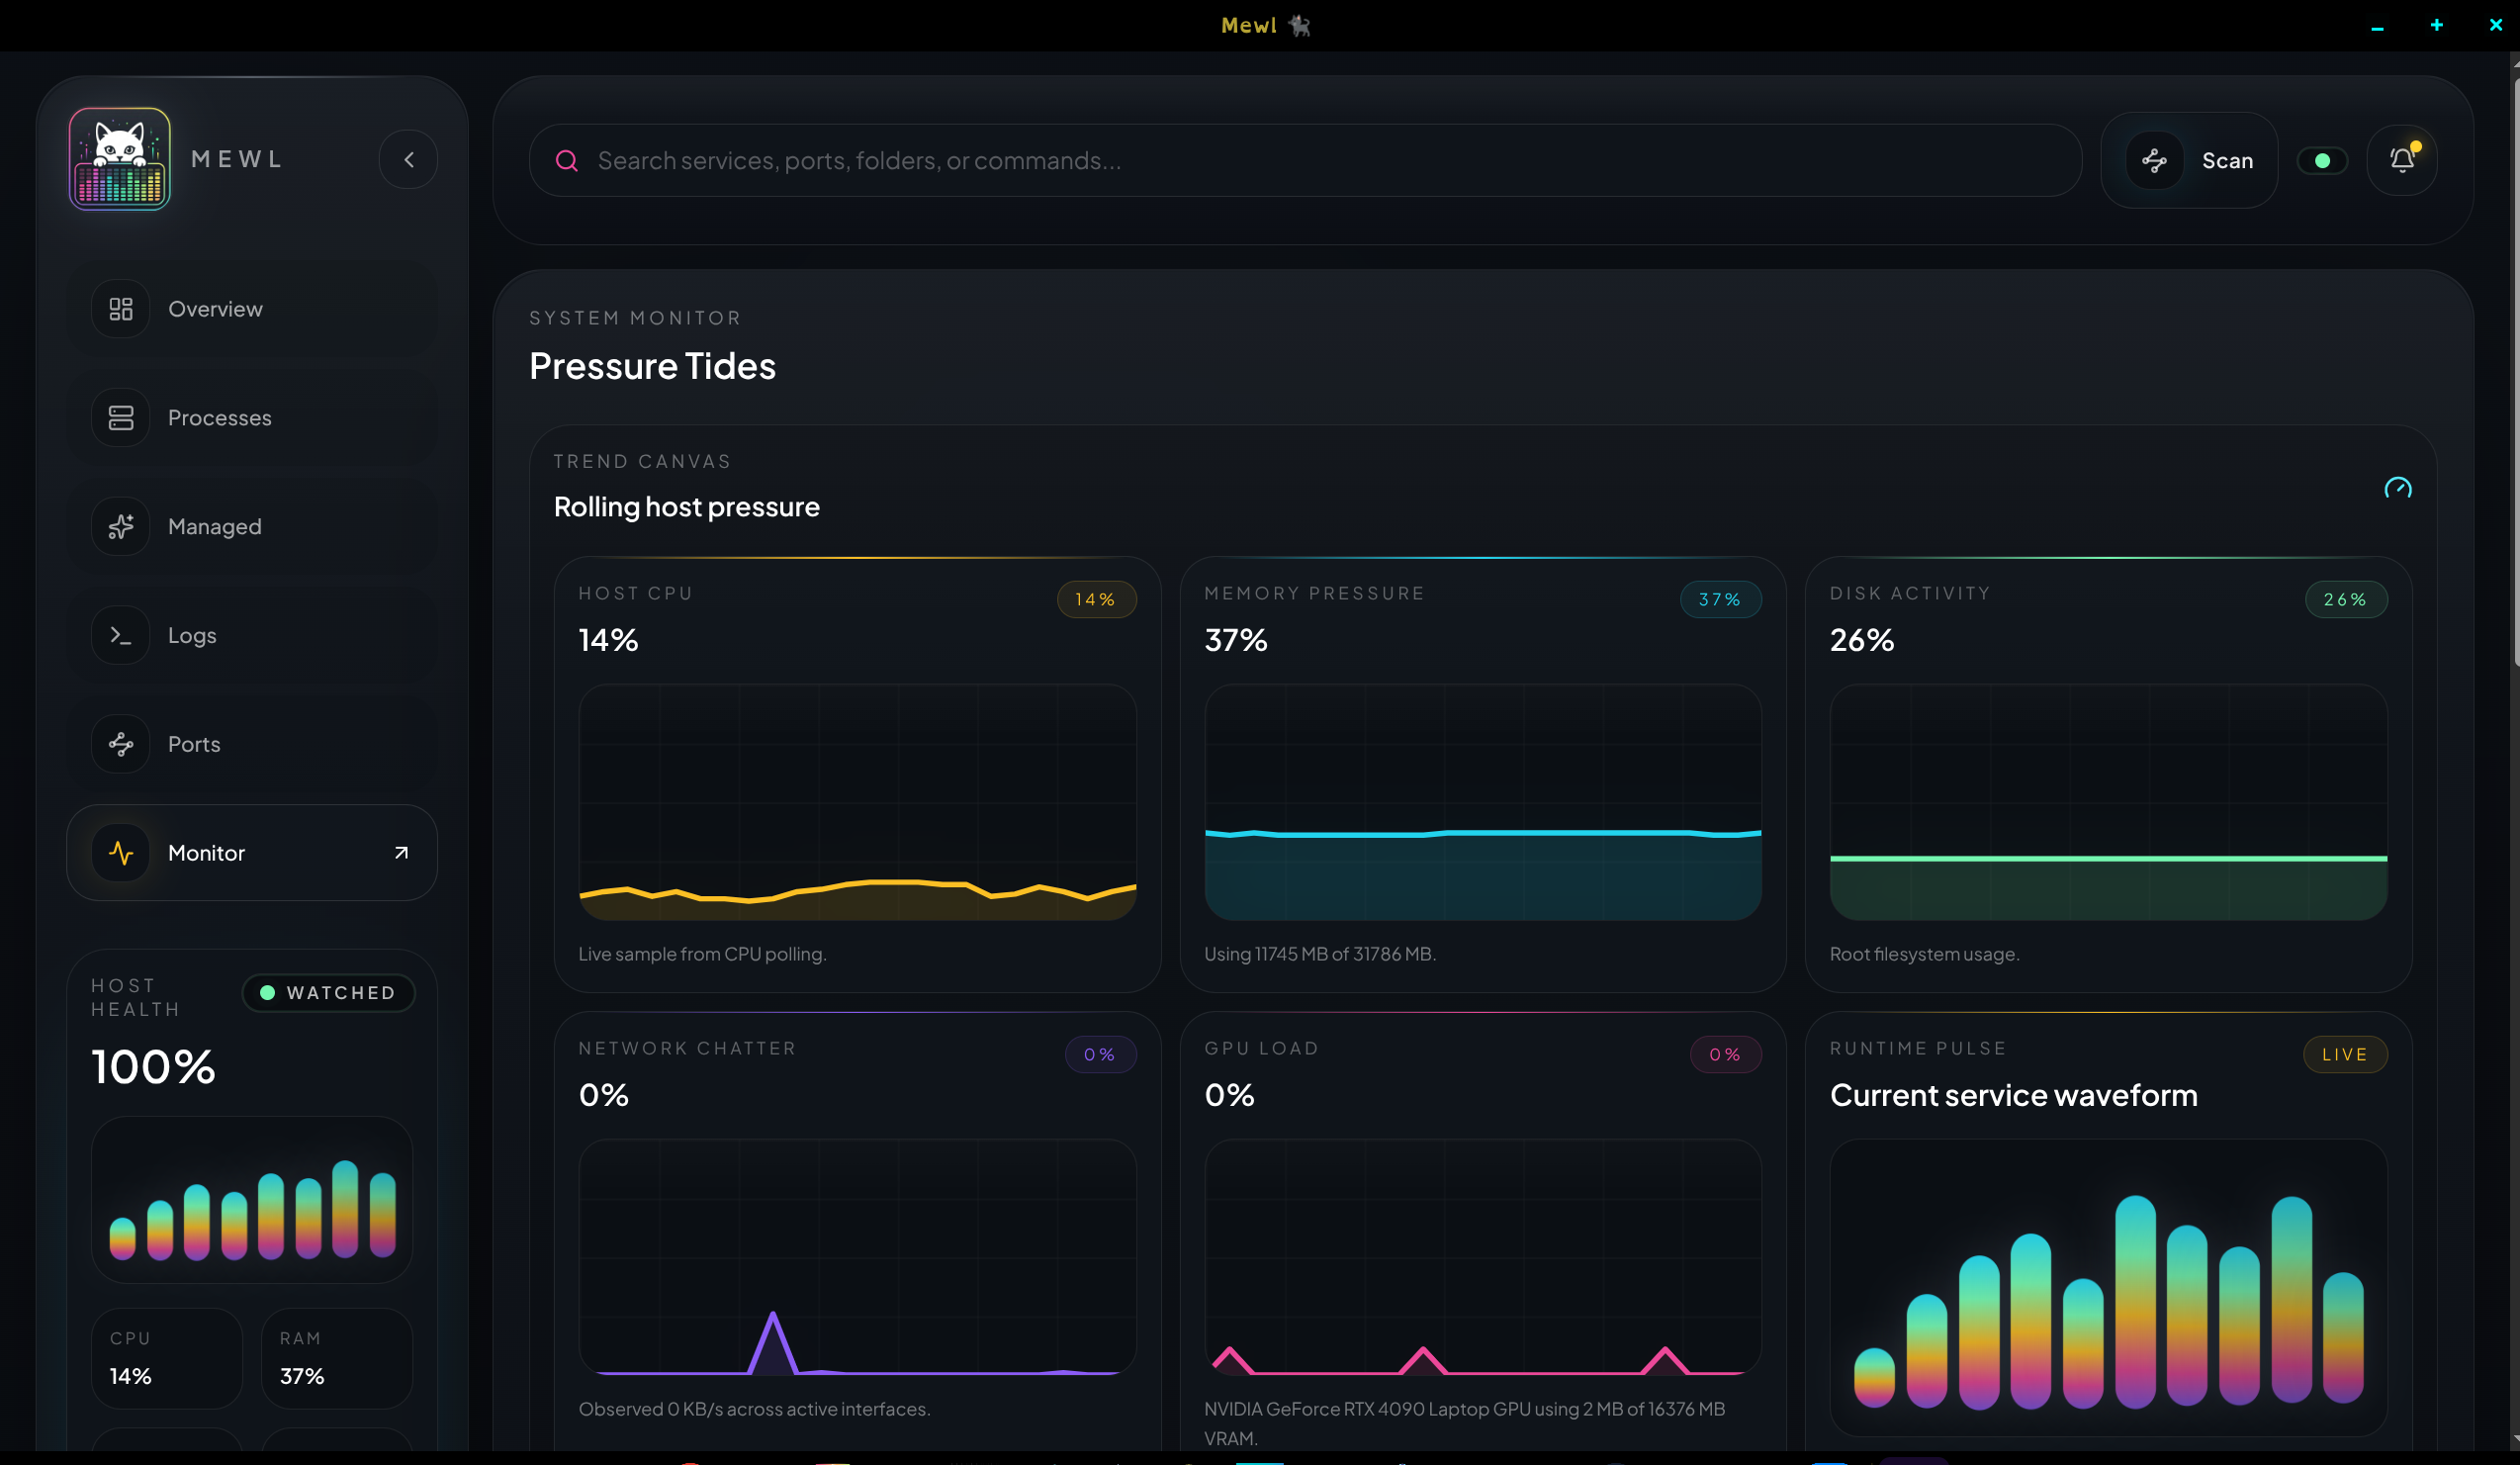
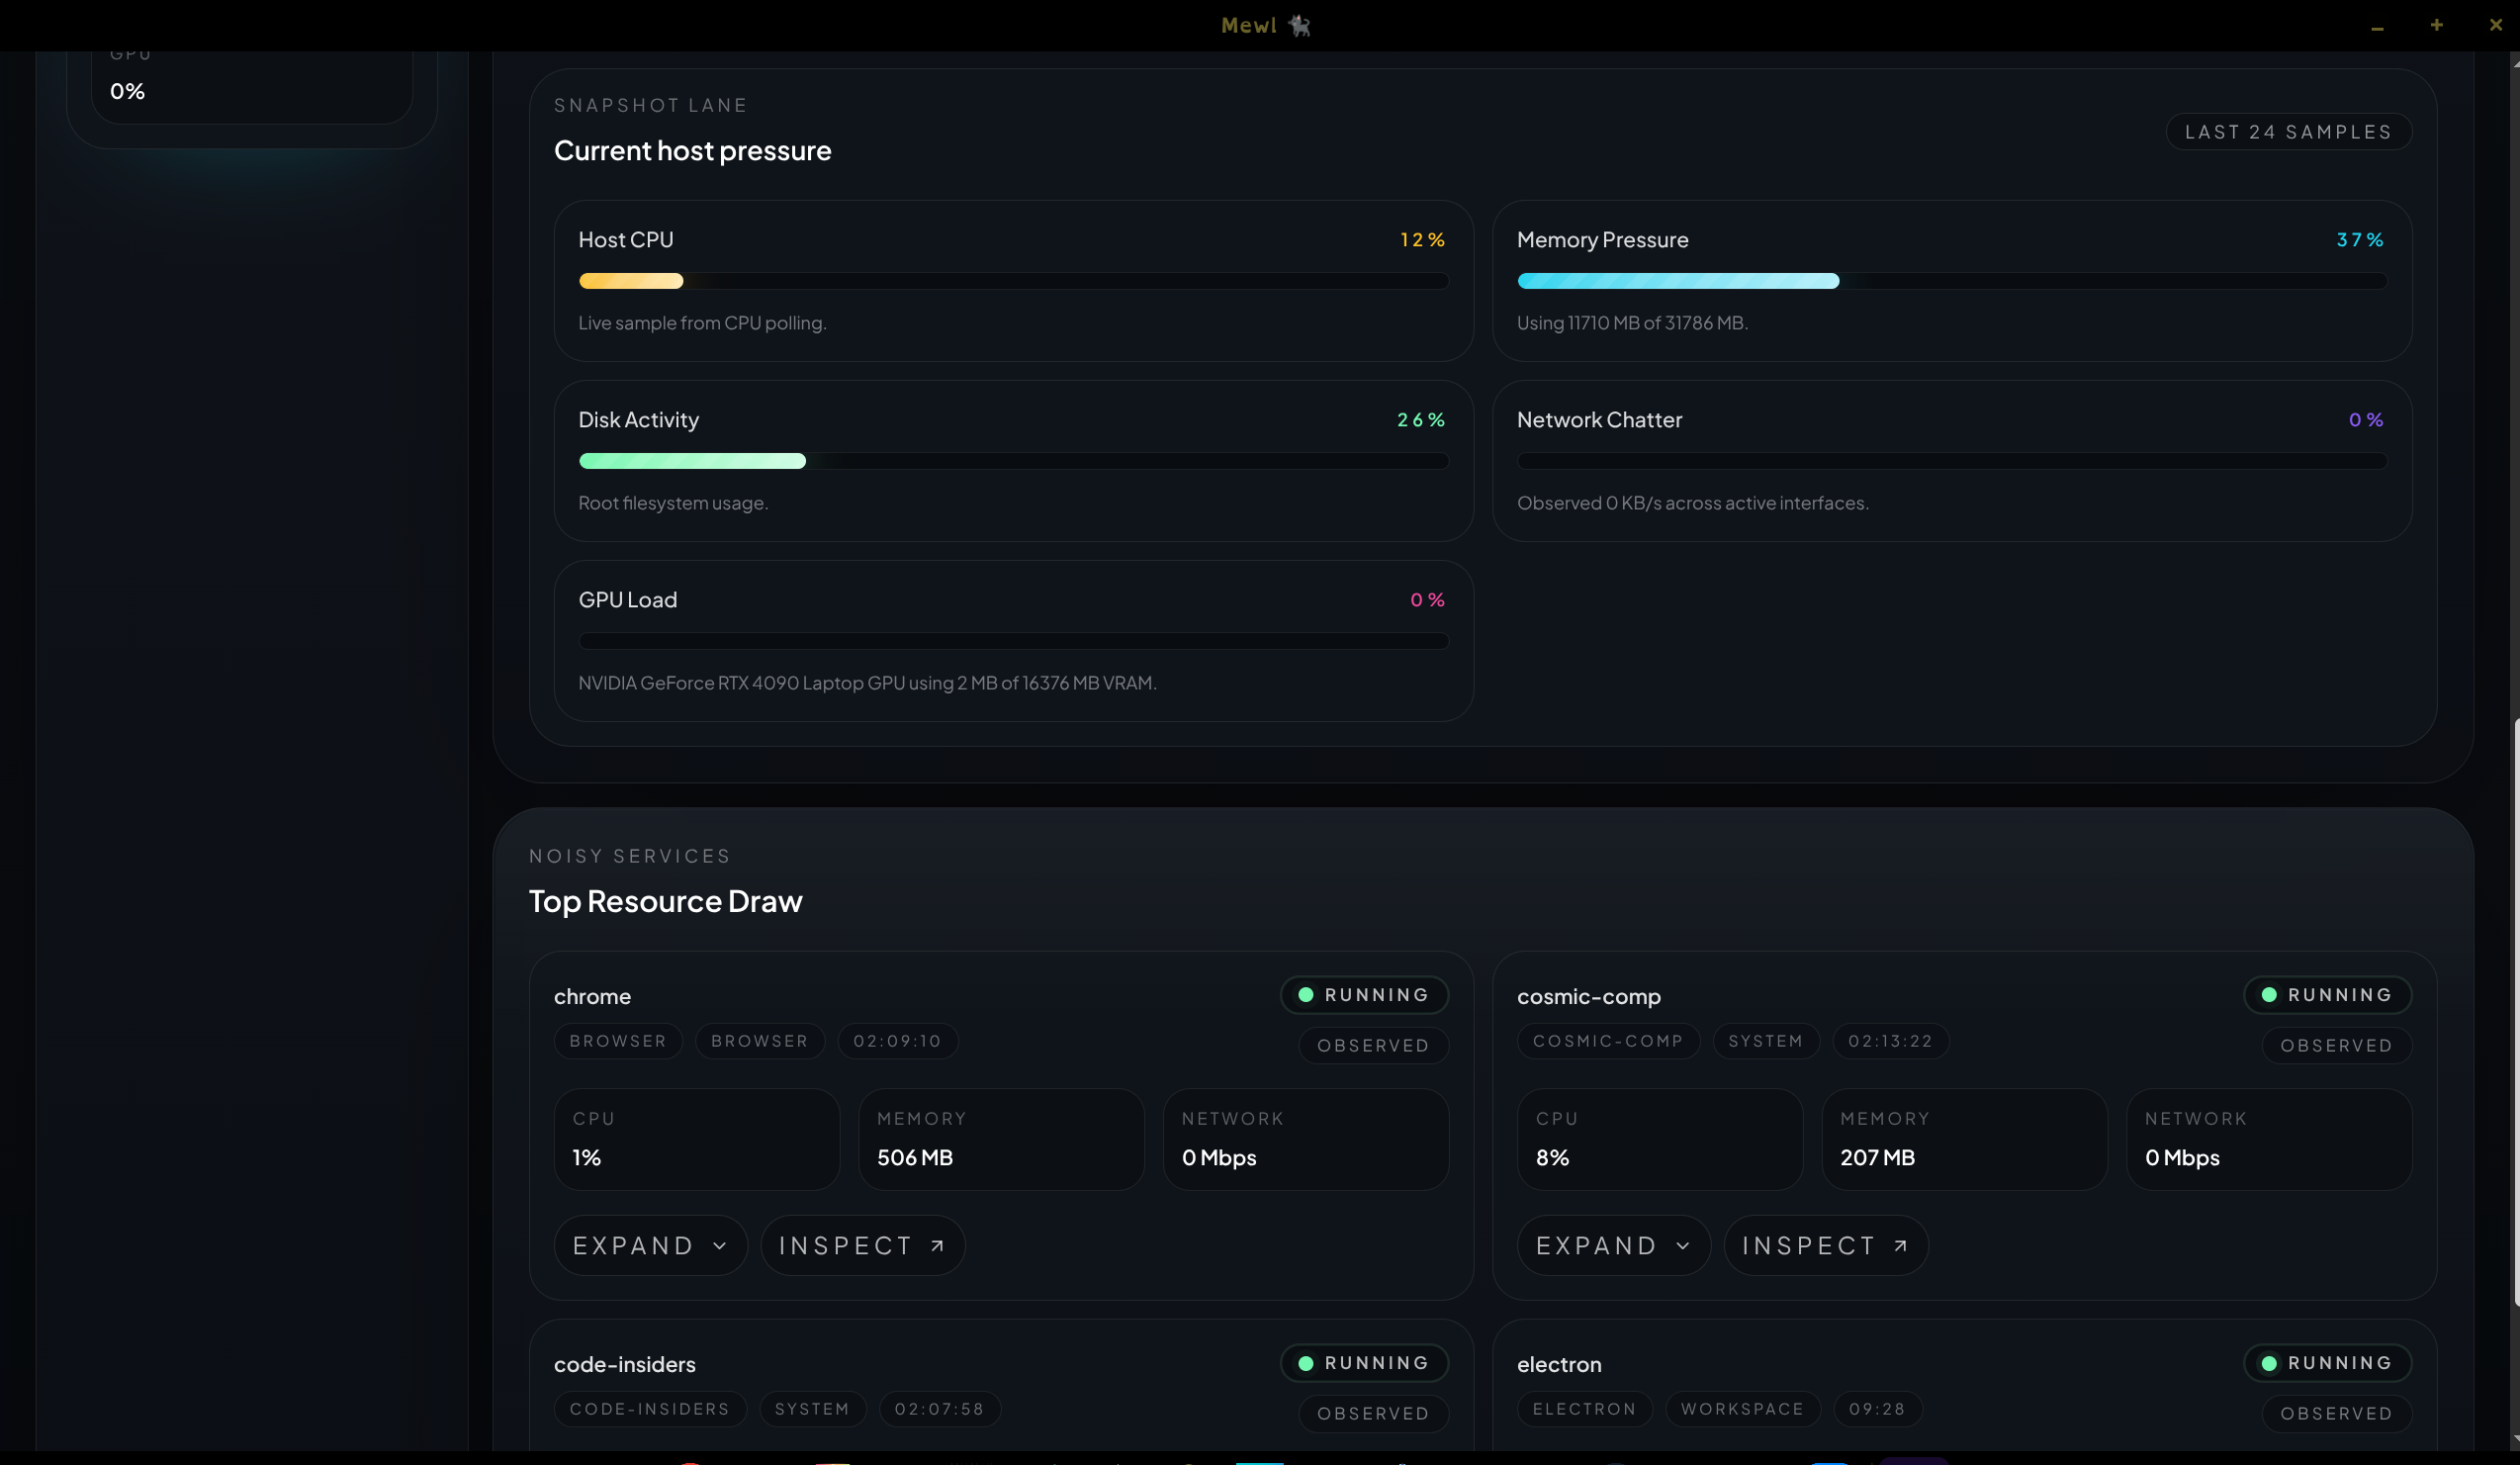
Host pressure
Section titled “Host pressure”The Monitor workspace keeps a short rolling history so charts feel live instead of decorative. Mewl samples:
- CPU
- memory
- disk
- network
- GPU, when the host exposes it
Alerts
Section titled “Alerts”Alerts are meant to stay actionable. Current runtime issues can include crash loops, reserved-port conflicts, and unhealthy resource spikes tied back to a specific service or time window.
Use alerts as the signal that something deserves attention, then use Logs, Ports, and Monitor together to explain why it happened.